
Retention by Product
Some products bring customers back better than others. Retention by Product groups first-time customers by the products in their first order, then shows how often those customers come back and how much they go on to spend. Use it to find the products that make the best first purchase: the ones worth featuring in ads, welcome flows, and first-order offers.
Use this page to answer three questions:
Which first-purchase products bring customers back most often?
Do those customers come back for the same product, or for something else?
Which first-purchase products lead to the most valuable customers?
The page has two tabs:
Repurchase Rate by Product shows how often customers come back, based on what they bought first.
LTV by Product shows how much those customers go on to spend, based on what they bought first.
Key terms
First-purchase product: a product in a customer's first order. If a customer's first order had three products, that customer is counted under all three.
Repurchased Anything: the customer placed another order later, for any product.
Repurchased Same Product: the customer later bought the same product again.
LTV (lifetime value): the average revenue per customer, including their first order and later orders.
Product vs. Variant: switch between grouping by product (for example, "Face Serum") or by variant (for example, "Face Serum – 30ml").
Who's included
Both tabs include every first-time customer since January 1, 2024. There's no date picker on this page. The filters at the top narrow which customers are included, based on their order history or profile properties.
Repurchase Rate by Product
Which first-purchase products bring customers back?
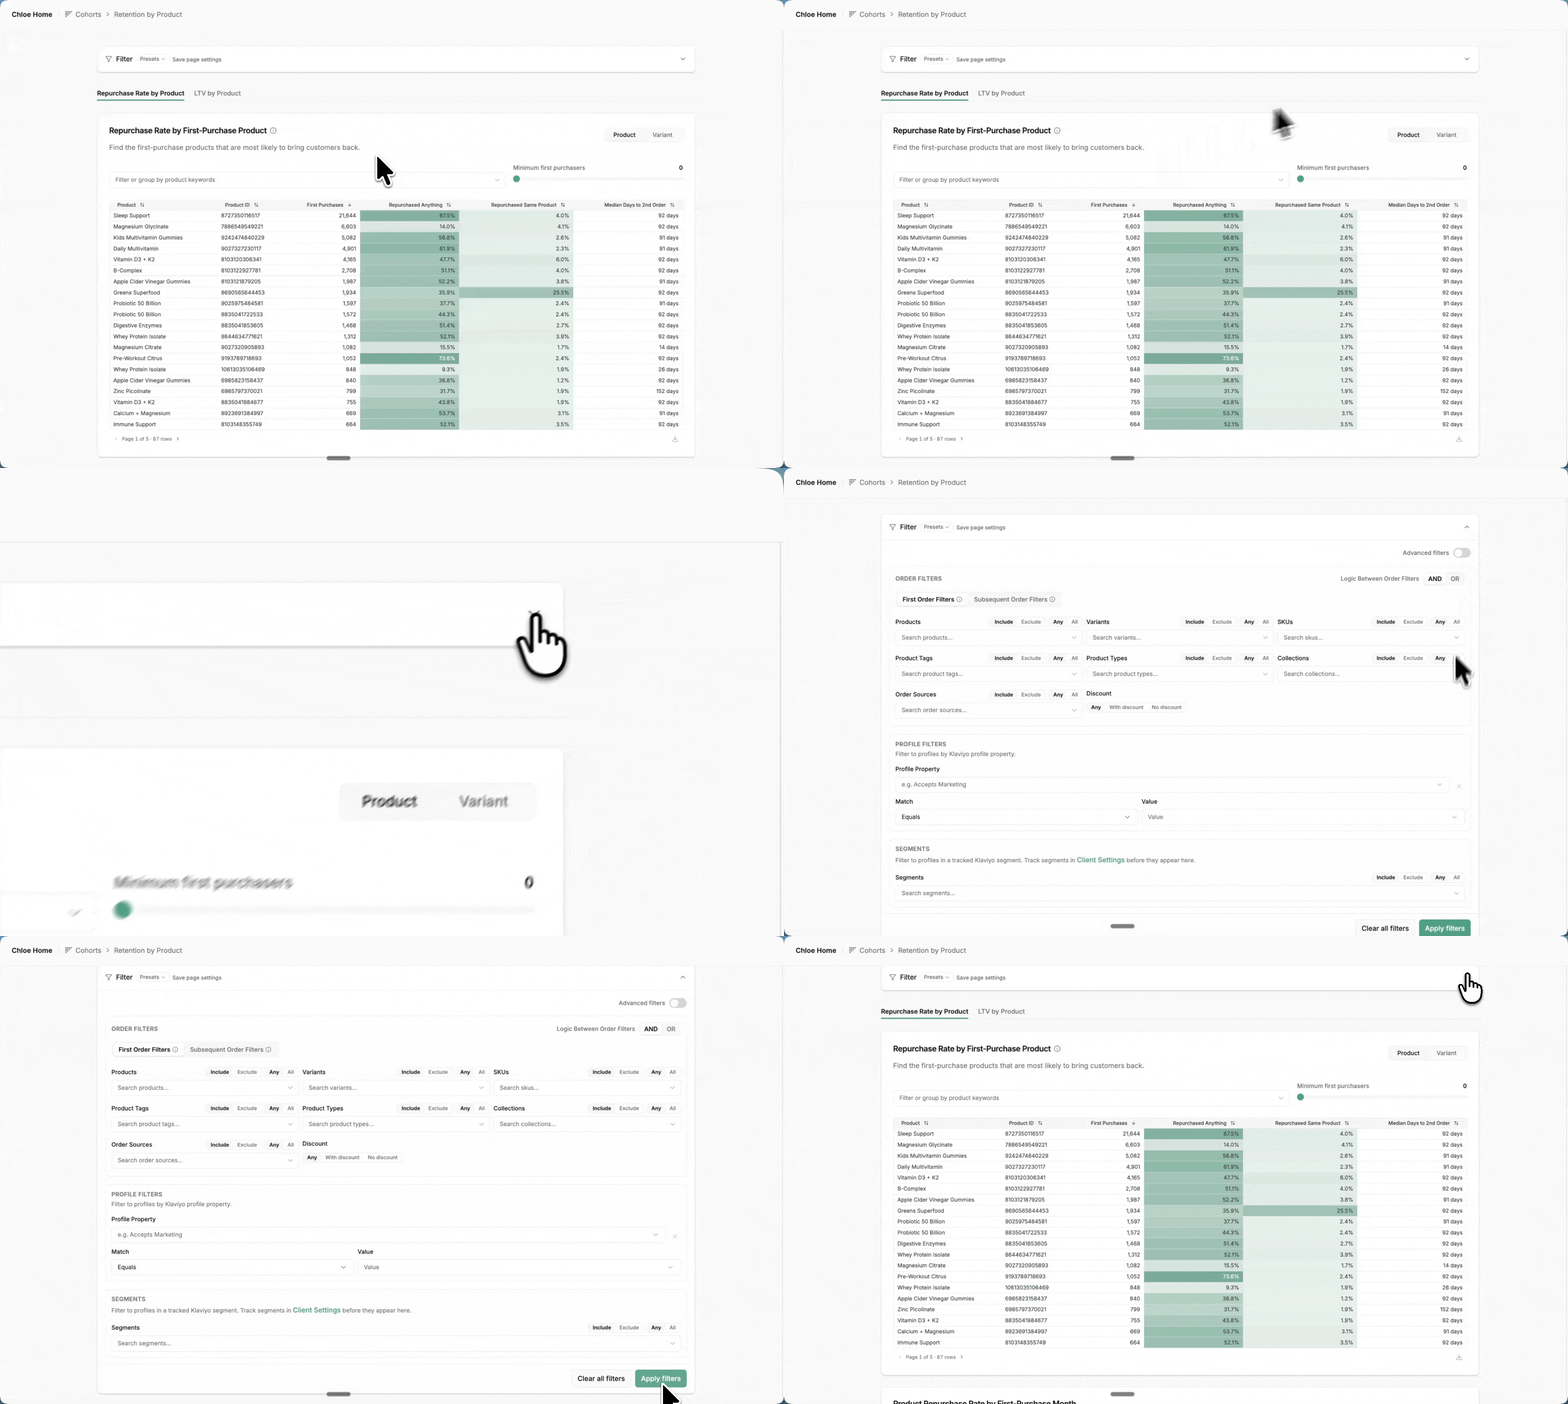
Use the controls and filter above the table to shape the view:
Product / Variant: choose how products are grouped.
Filter or group by product keywords: type a keyword and press Enter to show only matching products. Turn on Group by keyword to combine every matching product into one row, for example all products containing "Serum."
Minimum first purchasers: hide products with too few first-time customers to trust.
The table shows up to 100 products, sorted by the number of first-time customers.
Column | What it means |
|---|---|
First Purchases | How many first-time customers had this product in their first order |
Repurchased Anything | The share of those customers who placed another order, for any product |
Repurchased Same Product | The share who later bought this same product again |
Median Days to 2nd Order | For customers who came back, the typical number of days between their first and second order |
The rates in this table have no time limit. They count any later order up to today. A customer who first bought in January 2024 has had over a year to come back. A customer who first bought last month has barely had a chance. Products you launched recently will look lower in this table because more of their customers are new. To compare products fairly, use the trend chart below.
Product Repurchase Rate by First-Purchase Month
This chart compares selected products month by month, using the same time window for every point.
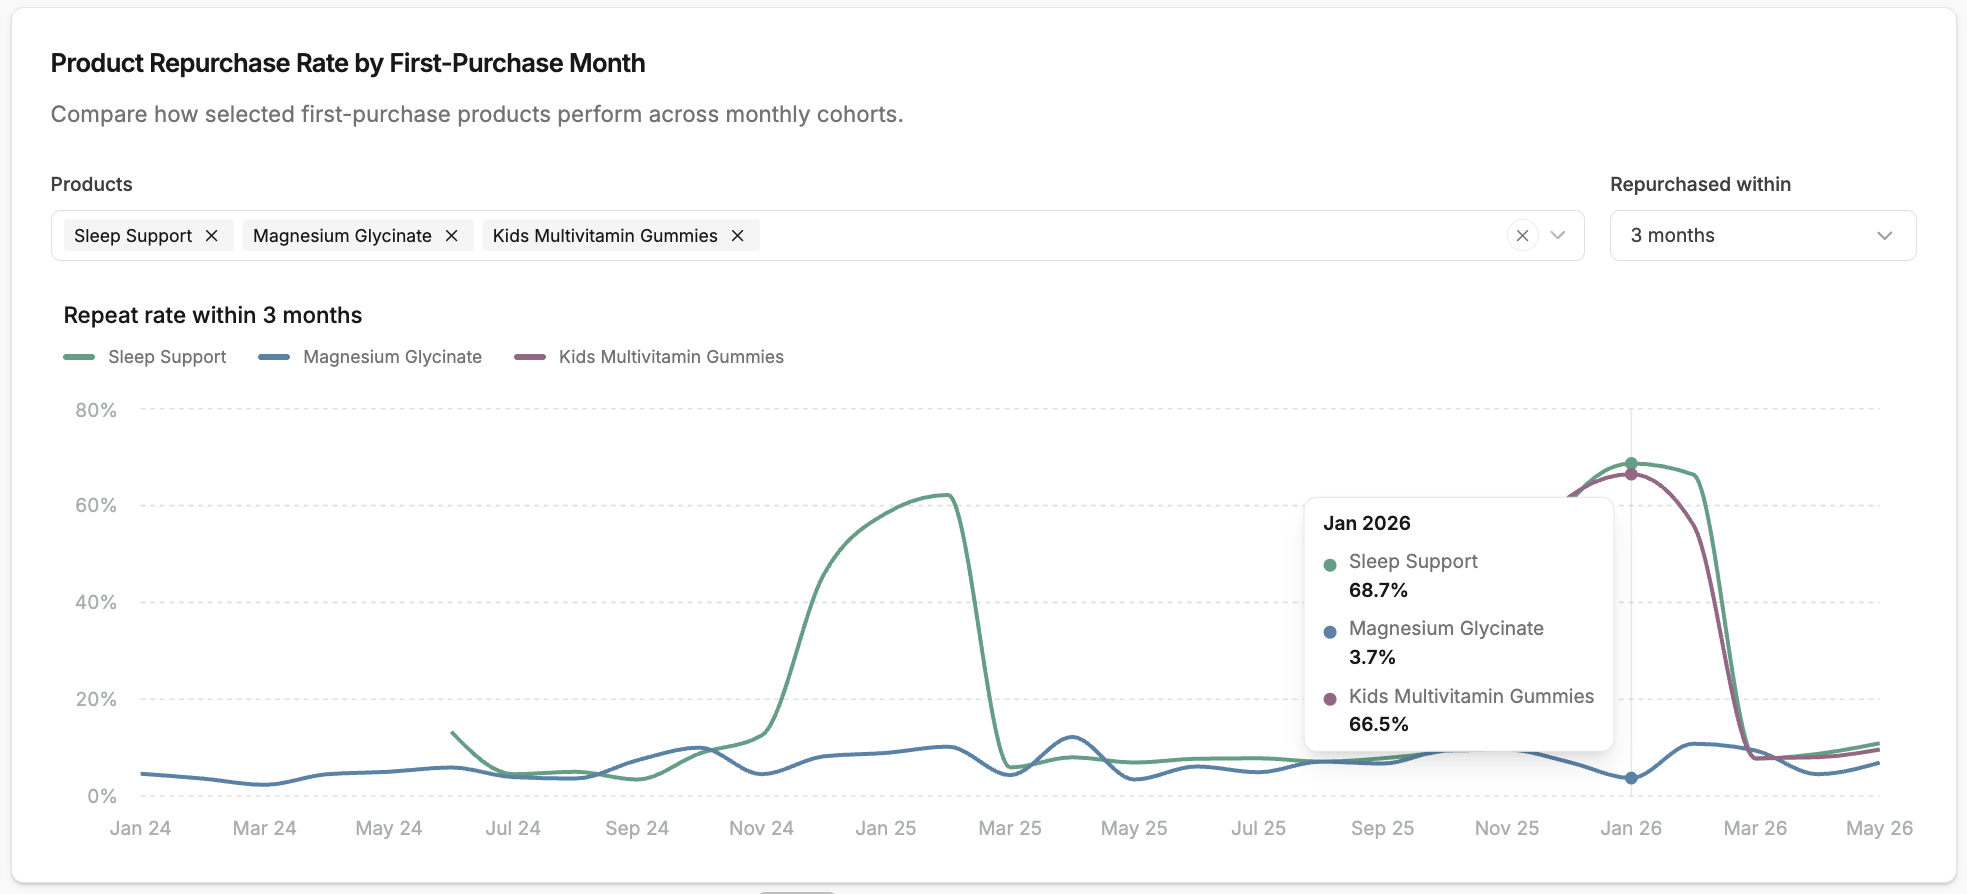
Search for and select the products you want to compare. Each product gets its own line.
Choose a Repurchased within window: 1, 3, 6, or 12 months.
Each point along the bottom is the month customers made their first purchase. Each line shows the share of that month's customers who came back, for any product, within the window.
Lines stop where recent months haven't had time to finish the window.
In this example, with Repurchased within set to 3 months, the January 2026 cohort shows a 68.7% repeat rate for customers whose first purchase was Sleep Support, compared with 66.5% for Kids Multivitamin Gummies and 3.7% for Magnesium Glycinate. Customers who first bought Sleep Support or Kids Multivitamin Gummies were much more likely to make another purchase within three months than customers who first bought Magnesium Glycinate. That could make the first two products promising starting points for repeat purchase campaigns.
LTV by Product
Which first-purchase products lead to the most valuable customers?
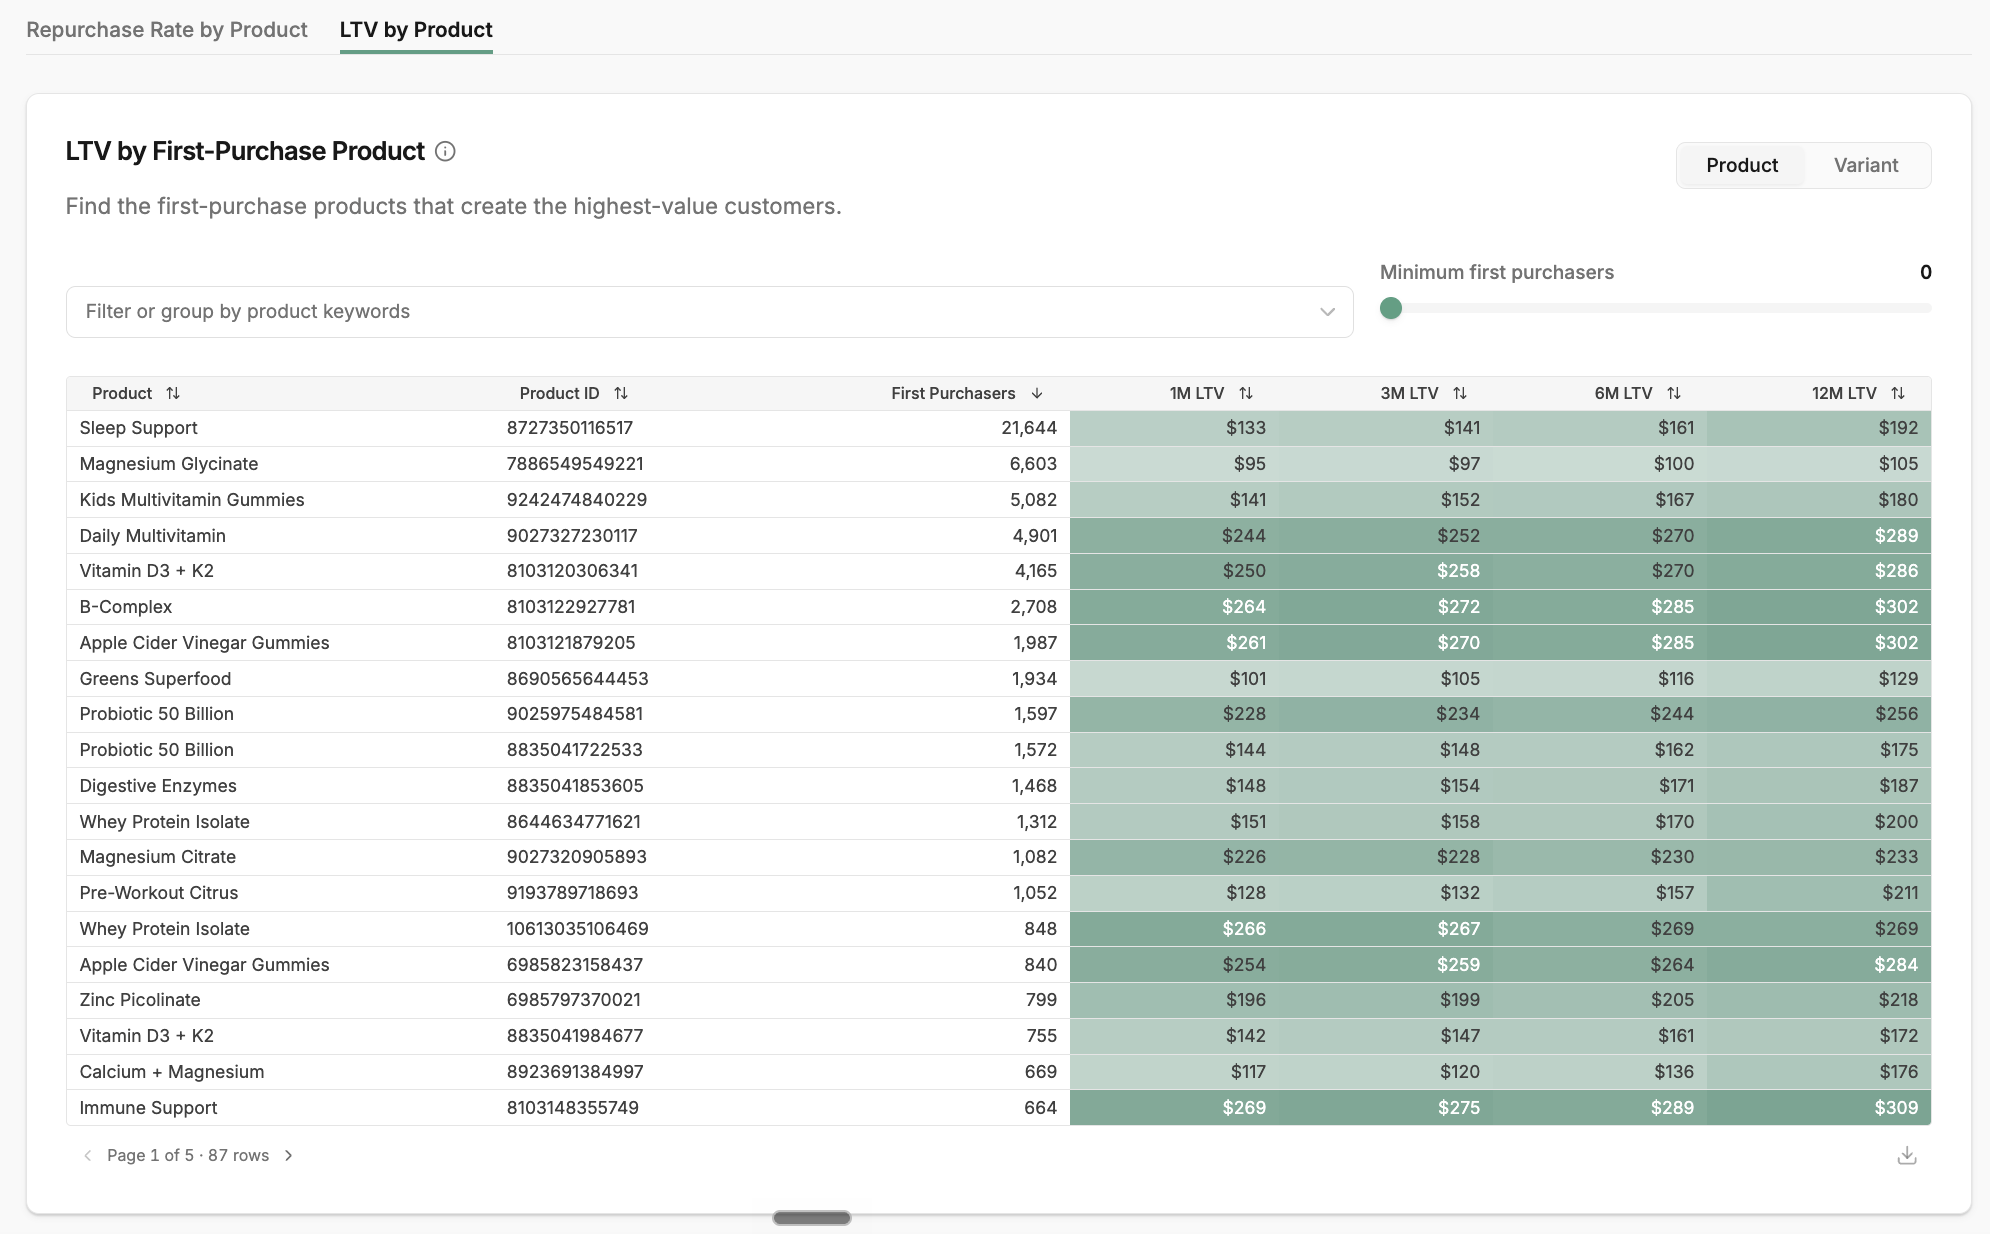
Column | What it means |
|---|---|
First Purchasers | How many first-time customers had this product in their first order |
1M / 3M / 6M / 12M LTV | Average revenue per customer within 1, 3, 6, or 12 months of their first order |
LTV counts everything the customer spent: their full first order, plus every later order within that time, from any product. It isn't just revenue from the product in that row.
Two things to keep in mind:
The whole first order counts. If customers often buy X product alongside a pricier product, the X product row includes that pricier product's revenue too.
Recent customers are included in every column. A customer who first bought two months ago is counted in 12M LTV, even though they've only had two months to spend. Products with a lot of recent customers will look lower in the 6M and 12M columns. Use the trend chart below for fair comparisons.
Product LTV by First-Purchase Month
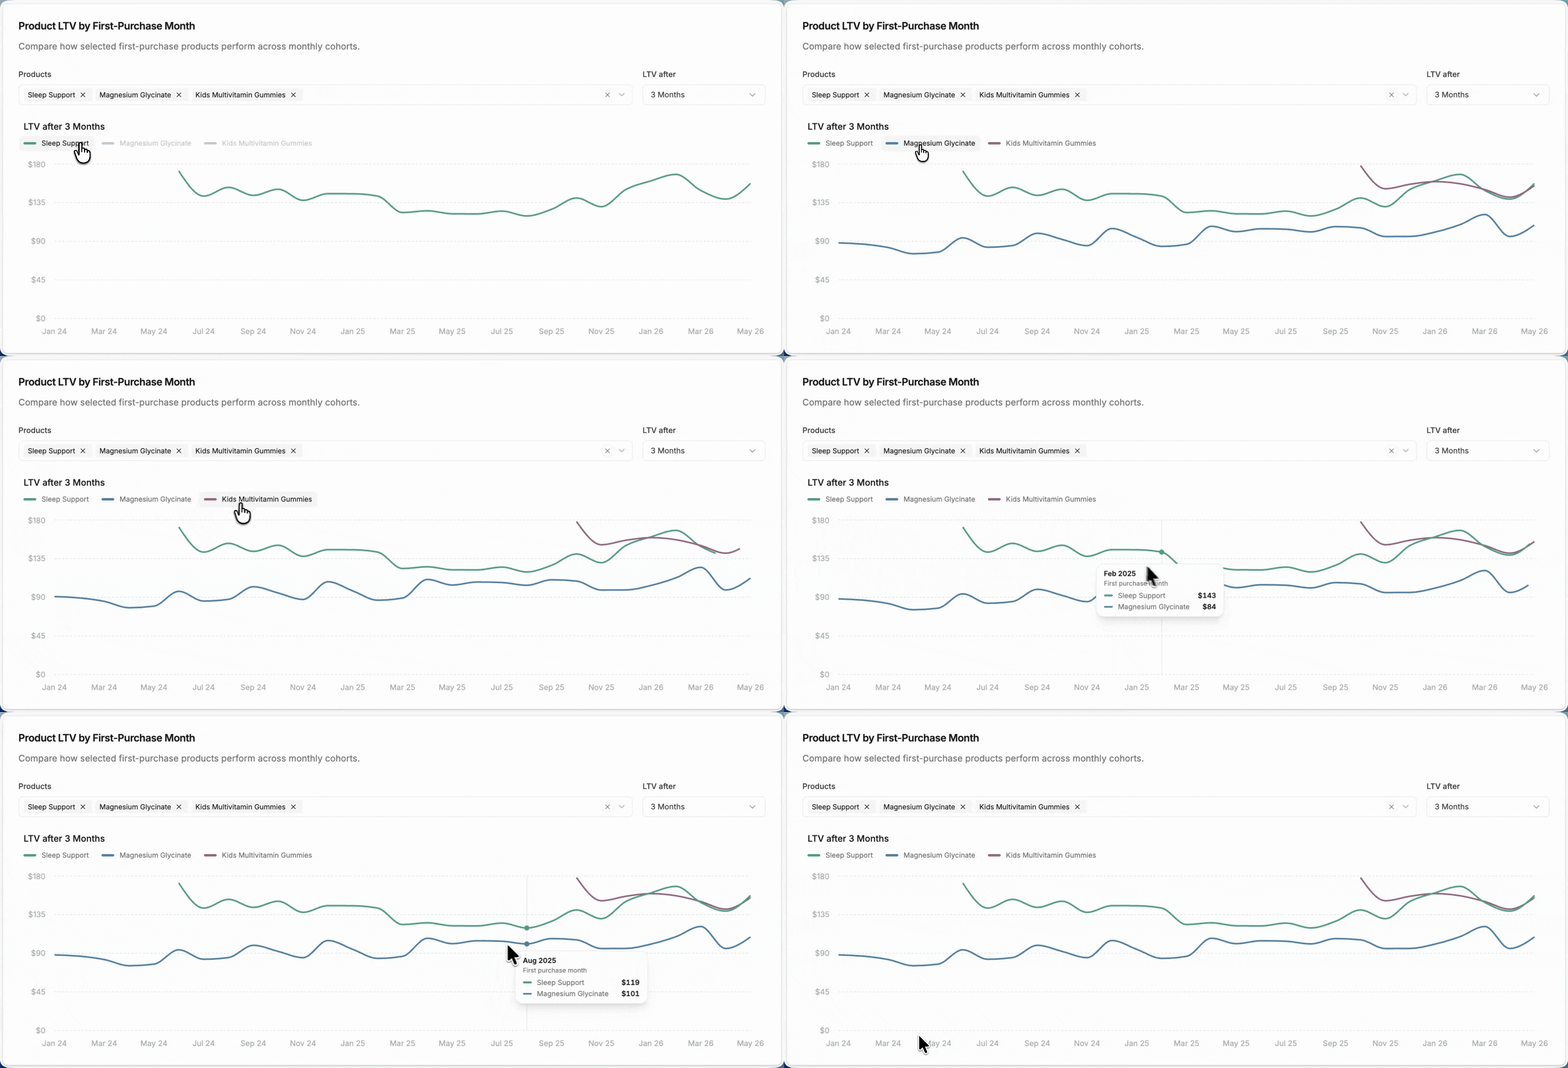
This chart works like the repurchase trend chart. Select products, choose a window, and each line shows the average revenue per customer for each first-purchase month. Every point uses the same window, and lines stop where recent months haven't had time to finish it.
Interpretation Tips
Find your best first-purchase products
Look for products that score well on both tabs: a high repurchase rate and a high LTV. These are your strongest first purchases, because customers who start with them tend to come back and keep spending. Test featuring them in acquisition ads, your welcome flow, and first-order offers.
Look for the opposite too. A product with lots of first purchases but a low repurchase rate and low LTV brings in customers who rarely return. These are often heavily discounted items, gifts, or samples. You don't have to stop selling them, but they may not be the best product to lead with. Or they may need a stronger post-purchase flow.
Decide between a replenishment message and a cross-sell
Compare Repurchased Same Product with Repurchased Anything.
The two rates are close: customers who come back mostly re-buy the same product. Test a replenishment reminder or a subscription offer, timed a little before the Median Days to 2nd Order.
Big gap between them: customers come back, but for something different. Test a cross-sell in your post-purchase flow. Use Product Paths to see which products they buy next.
Time your post-purchase messages
Median Days to 2nd Order tells you when customers who start with a product usually come back. If customers typically return for a product around day 41, a reminder around days 30–35 reaches them before most have reordered.
Common mistakes to avoid
Trusting small numbers. A product with 12 first-time customers can show a 50% repurchase rate by chance. Use the minimum first purchasers slider to hide small groups.
Adding up rows. A customer whose first order had several products is counted under each one, so the rows add up to more than your total number of customers.
Comparing products of different ages in the top tables. Products with more recent customers will look worse. Use the trend charts to compare products using the same time window.
Reading LTV as product revenue. LTV is everything those customers spent, from any product, not just sales of that product.
Reading Median Days too broadly. It only counts customers who came back. It doesn't tell you anything about customers who never returned.