
How to use the Report Generator
The Report Generator turns Hiro's live performance data into polished, client-ready PDF reports — export on demand or put them on a schedule so the report runs itself.
Where to find it
Open the Report Generator from the left-side navigation. You can collapse the navigation to give the tool more room once you're in it.

Finding and opening a report
The report picker at the top of the page shows every saved report for the currently selected client. The report picker is searchable — start typing a report name and it filters the list. Each report shows its title and last-updated date. Select a report to load it into the editor.
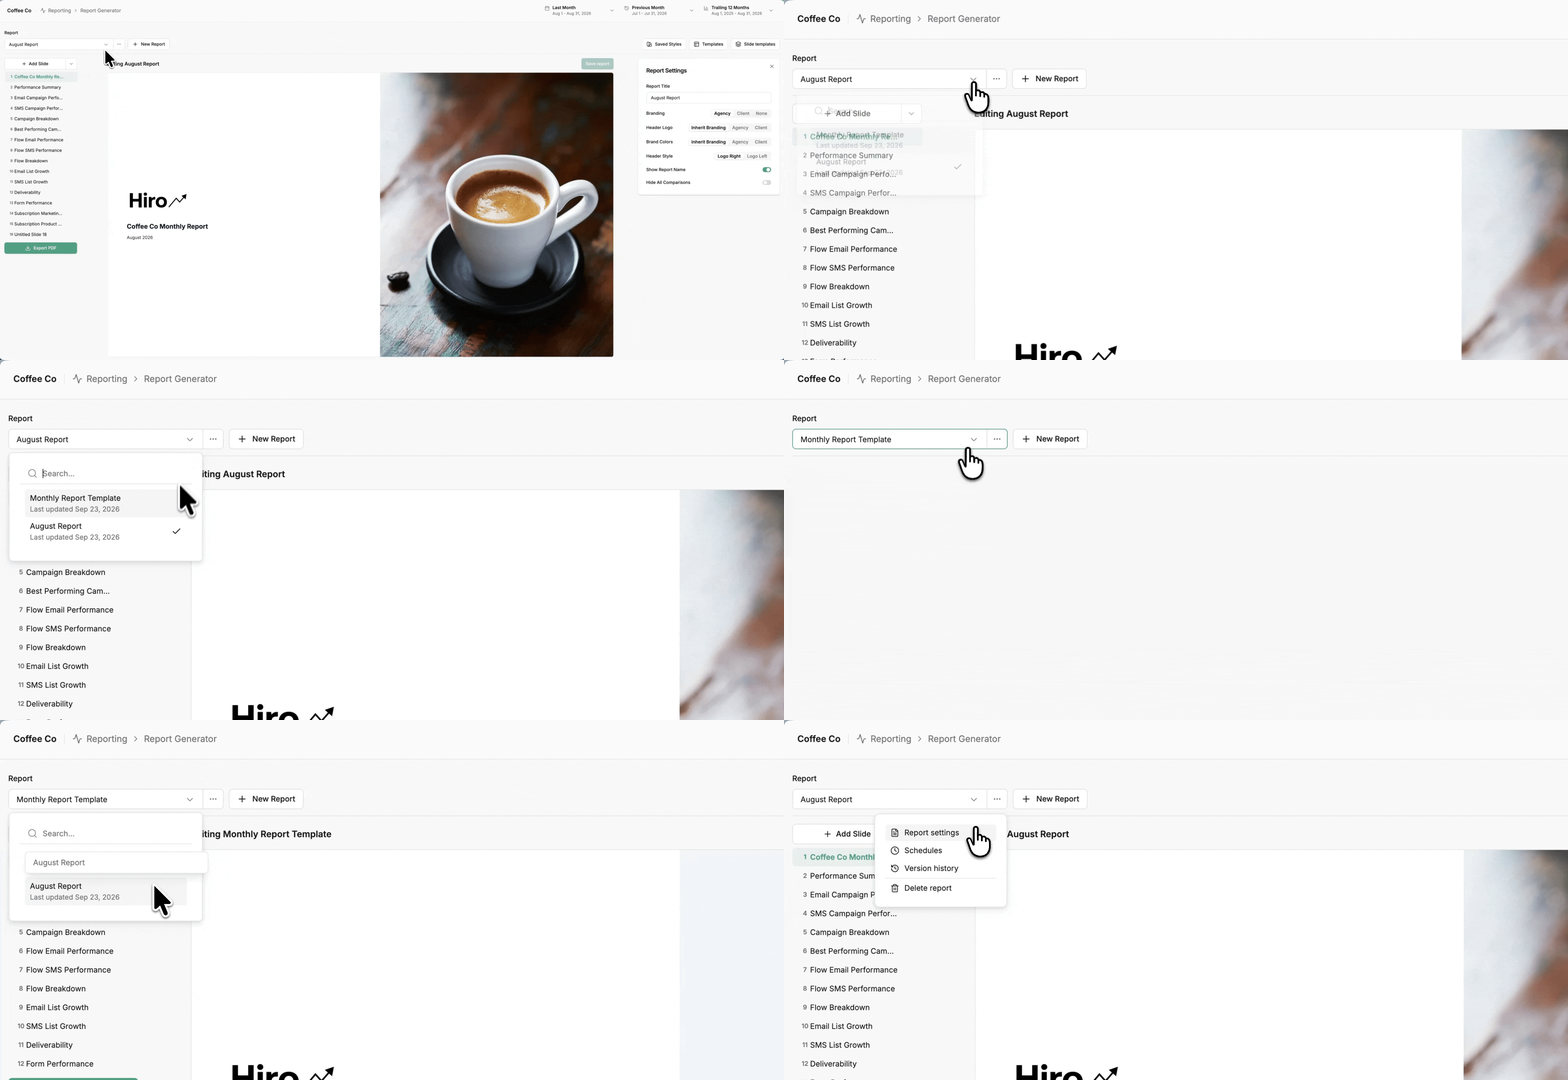
To start a new report: select New Report. A blank report opens in the editor.
To open report options, select the ⋯ button next to the report picker. The menu has four options:
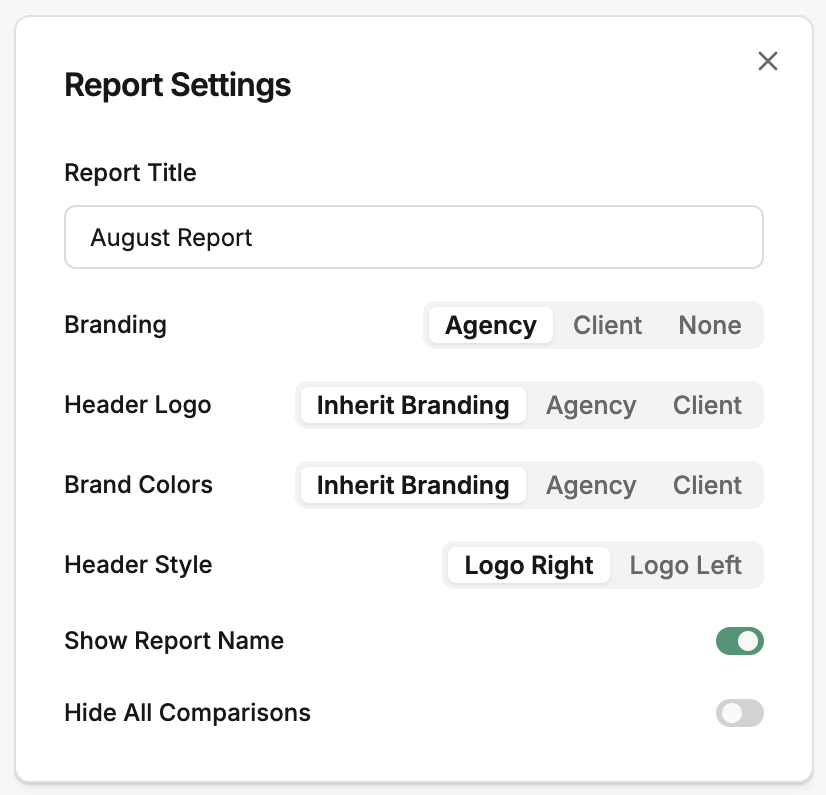
Report settings — rename the report, toggle the report name in the header, and show or hide all comparison periods across the report and change the report branding as needed.
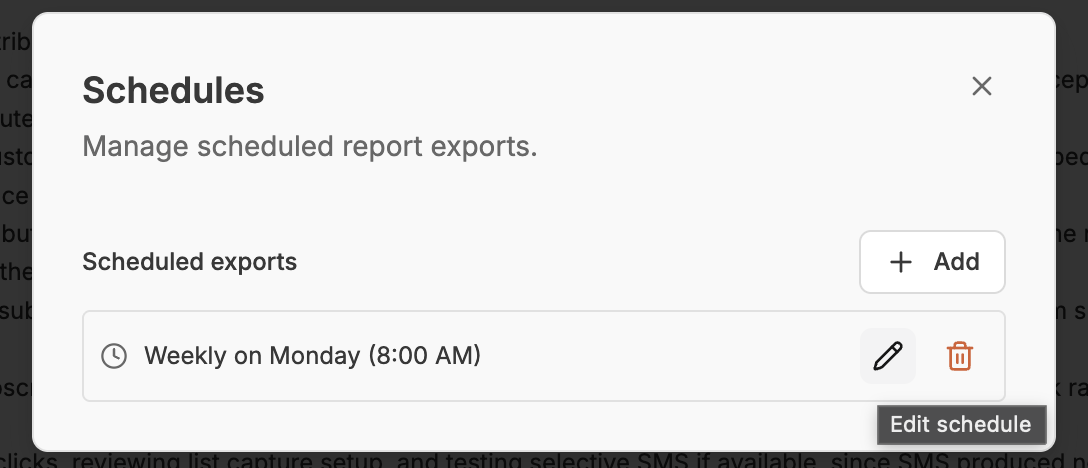
Schedules — view, add, edit, and delete scheduled exports for this report. Each schedule controls the cadence (daily / weekly / monthly), recipients, which slides are included, and whether AI notes regenerate when the export runs. Use this to put a recurring report on autopilot.
Version history — view and restore previous saved versions of the report. Use this if a recent edit went too far or a slide's content changed unexpectedly — you can roll the report back to an earlier version without having to rebuild it by hand.
Delete report — permanently remove the report. Deleting a report also removes its slides, notes, and any saved AI context for that report. Scheduled exports tied to the report stop running.
Setting the time frame and comparison
The date picker at the top of the page controls three things: the current period your report covers, the previous period to compare against, and the over-time charts range. These are global — every slide and component in the report reads from them.
Current Period
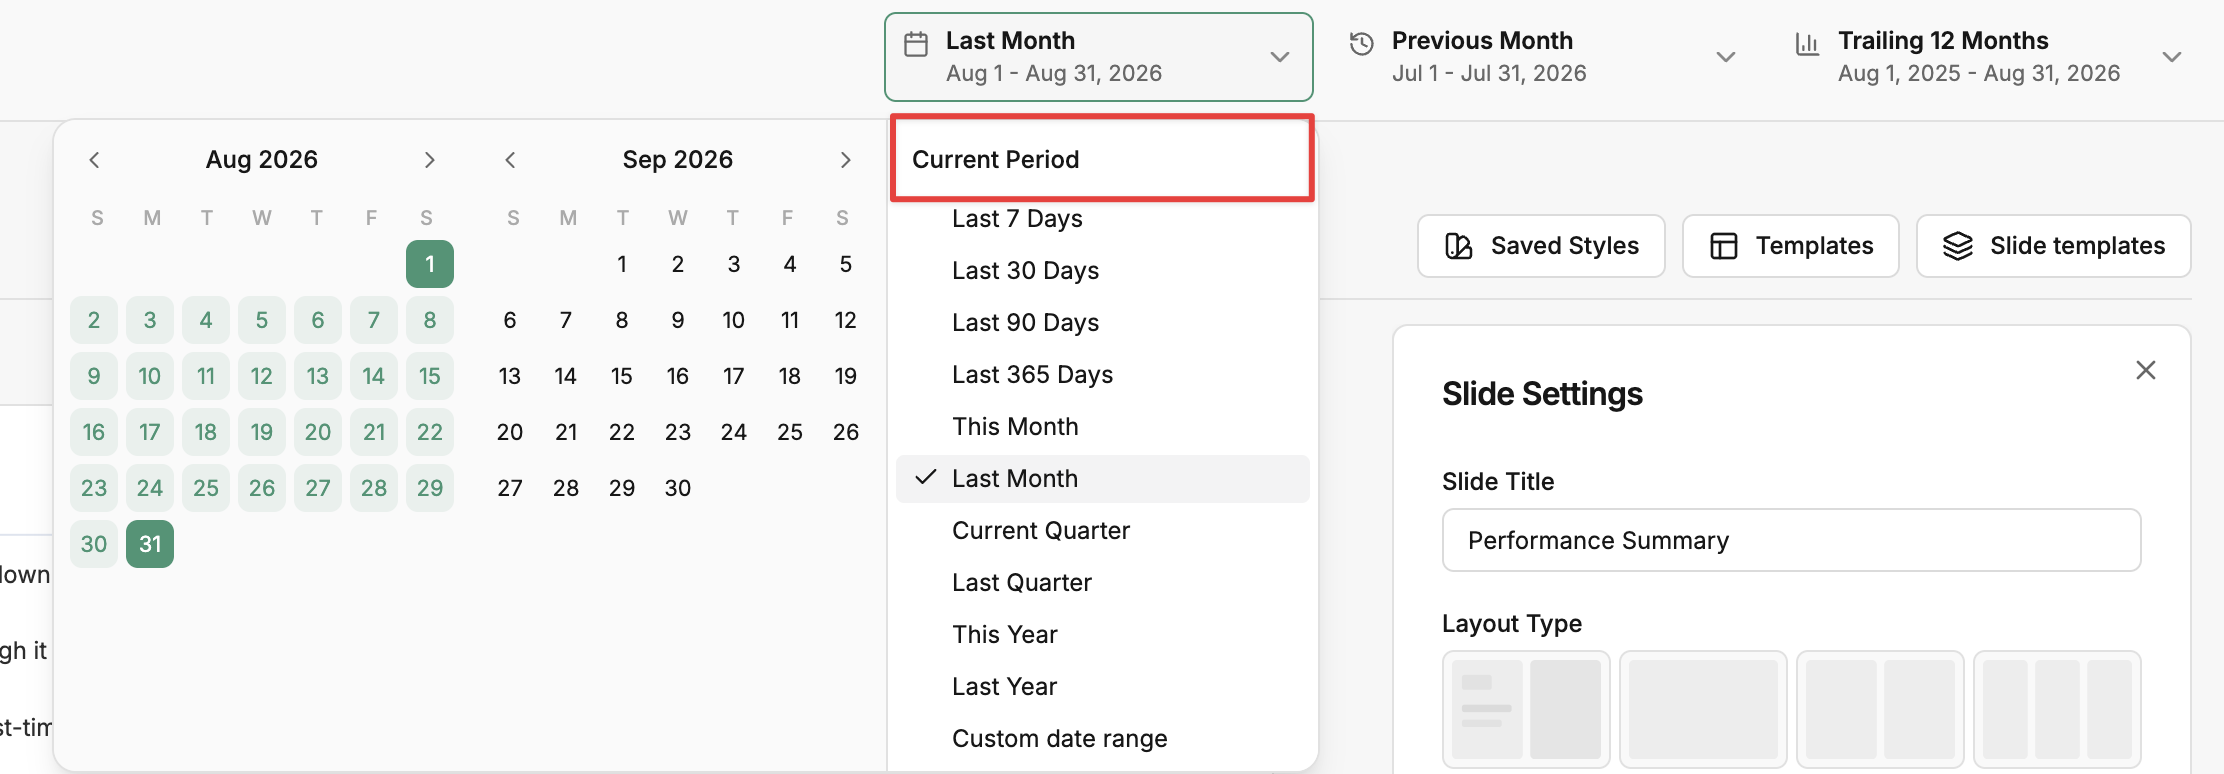
The main date range your report covers. Pick a preset (Last 30 Days, Last Month, Month-to-Date, Year-to-Date, etc.) or choose Custom to set your own start and end dates. Every metric on every slide reflects this range.
Previous Period (comparison)
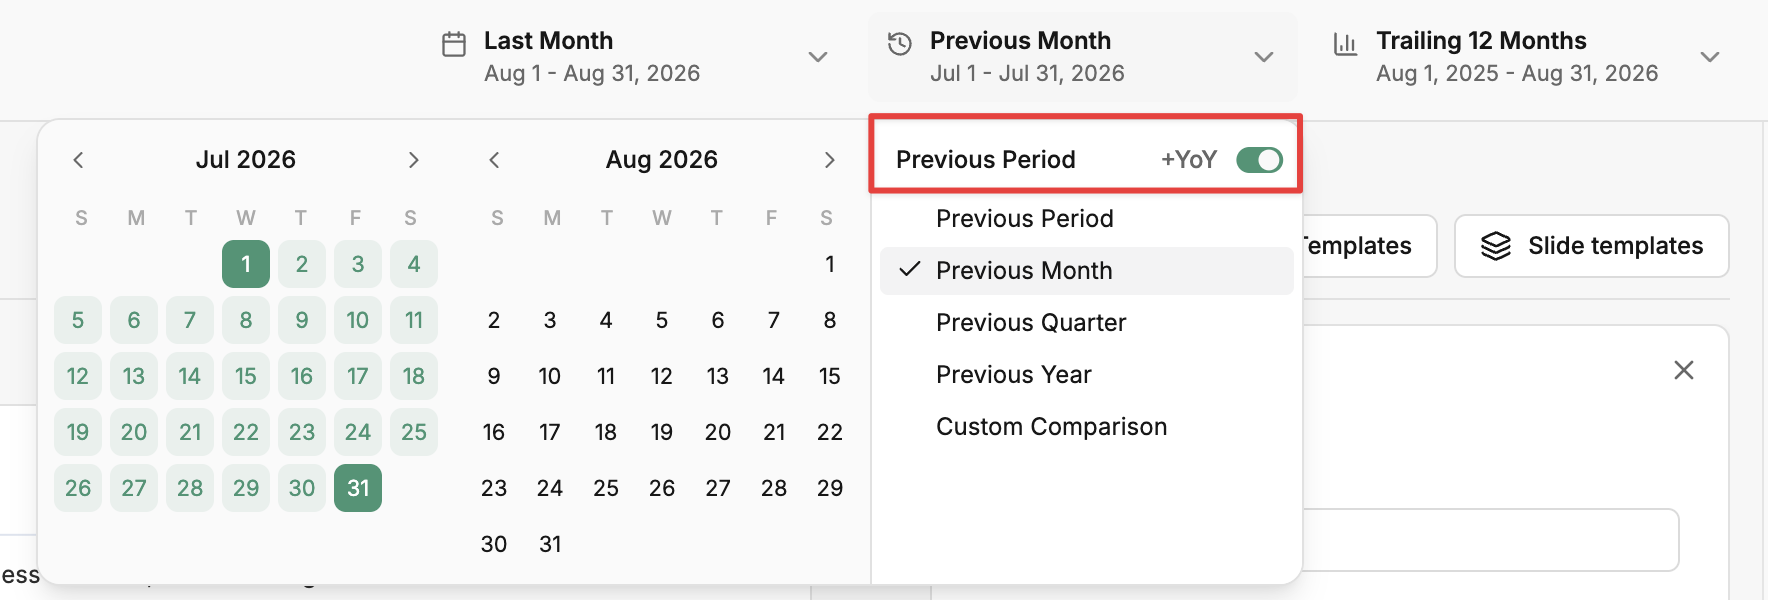
The period to compare against. Comparison pills show the delta with a short label — vs. (previous period), MoM (previous month), QoQ (previous quarter), YoY (previous year) — so you can see at a glance whether a number is up or down versus the prior period. Choose Previous Year for a year-over-year comparison.
+YoY toggle
Next to the Previous Period control, the +YoY toggle adds a second comparison against the same range one year earlier. Use it when you want both period-over-period and year-over-year on the same component — for example, last month vs. the month before, plus last month vs. the same month last year. The toggle is disabled when the Previous Period is already set to Previous Year, since that's already a YoY comparison.
Over Time Charts
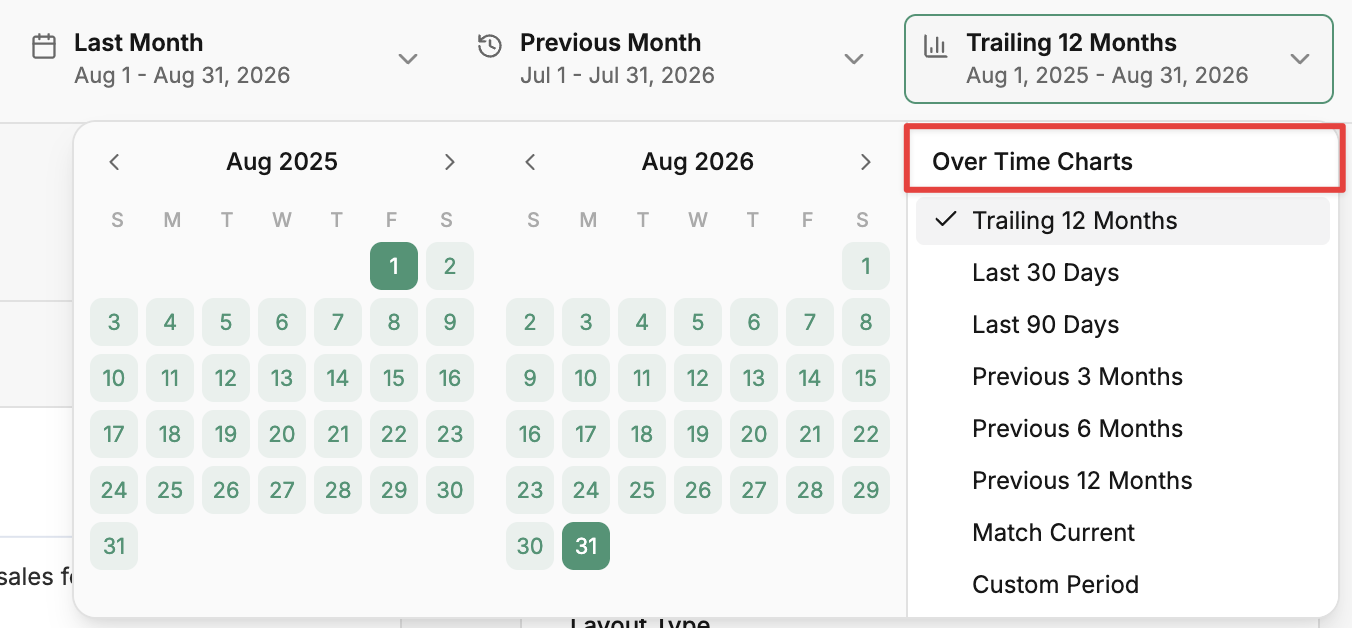
A separate range that controls what over-time charts and over-time tables display — independent of the Current Period. Defaults to Trailing 12 Months.
This is independent on purpose: your over-time charts can show a longer trend than the snapshot period. A common setup is Current Period = last month, Over Time Charts = trailing 12 months — so each slide shows the month's number with comparison, and the over-time chart shows the 12-month trend leading into it.
Hiding comparisons across a report
If you want a cleaner client-facing view with no comparison pills, open Report settings (⋯ menu → Report settings) and toggle on Hide all comparisons.
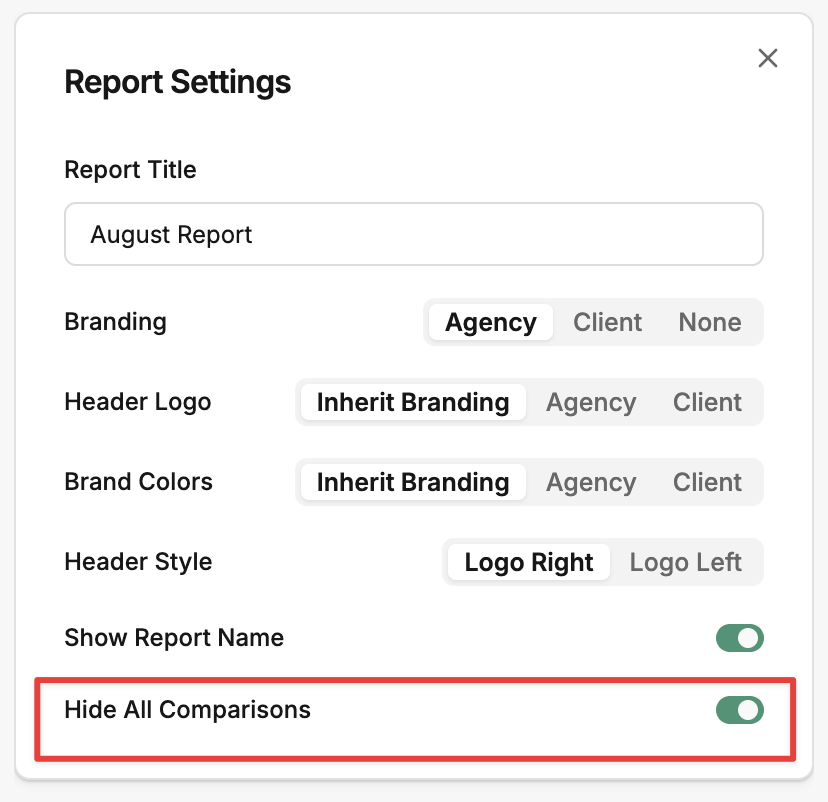
This strips the comparison columns and pills across every slide in the report without changing the underlying data — useful for executive summaries where the deltas are noise.
Adding and editing slides
Every report is a series of slides. The left panel lists your slides in order; select one to edit it, or use the controls on each slide to reorder, duplicate, or delete.
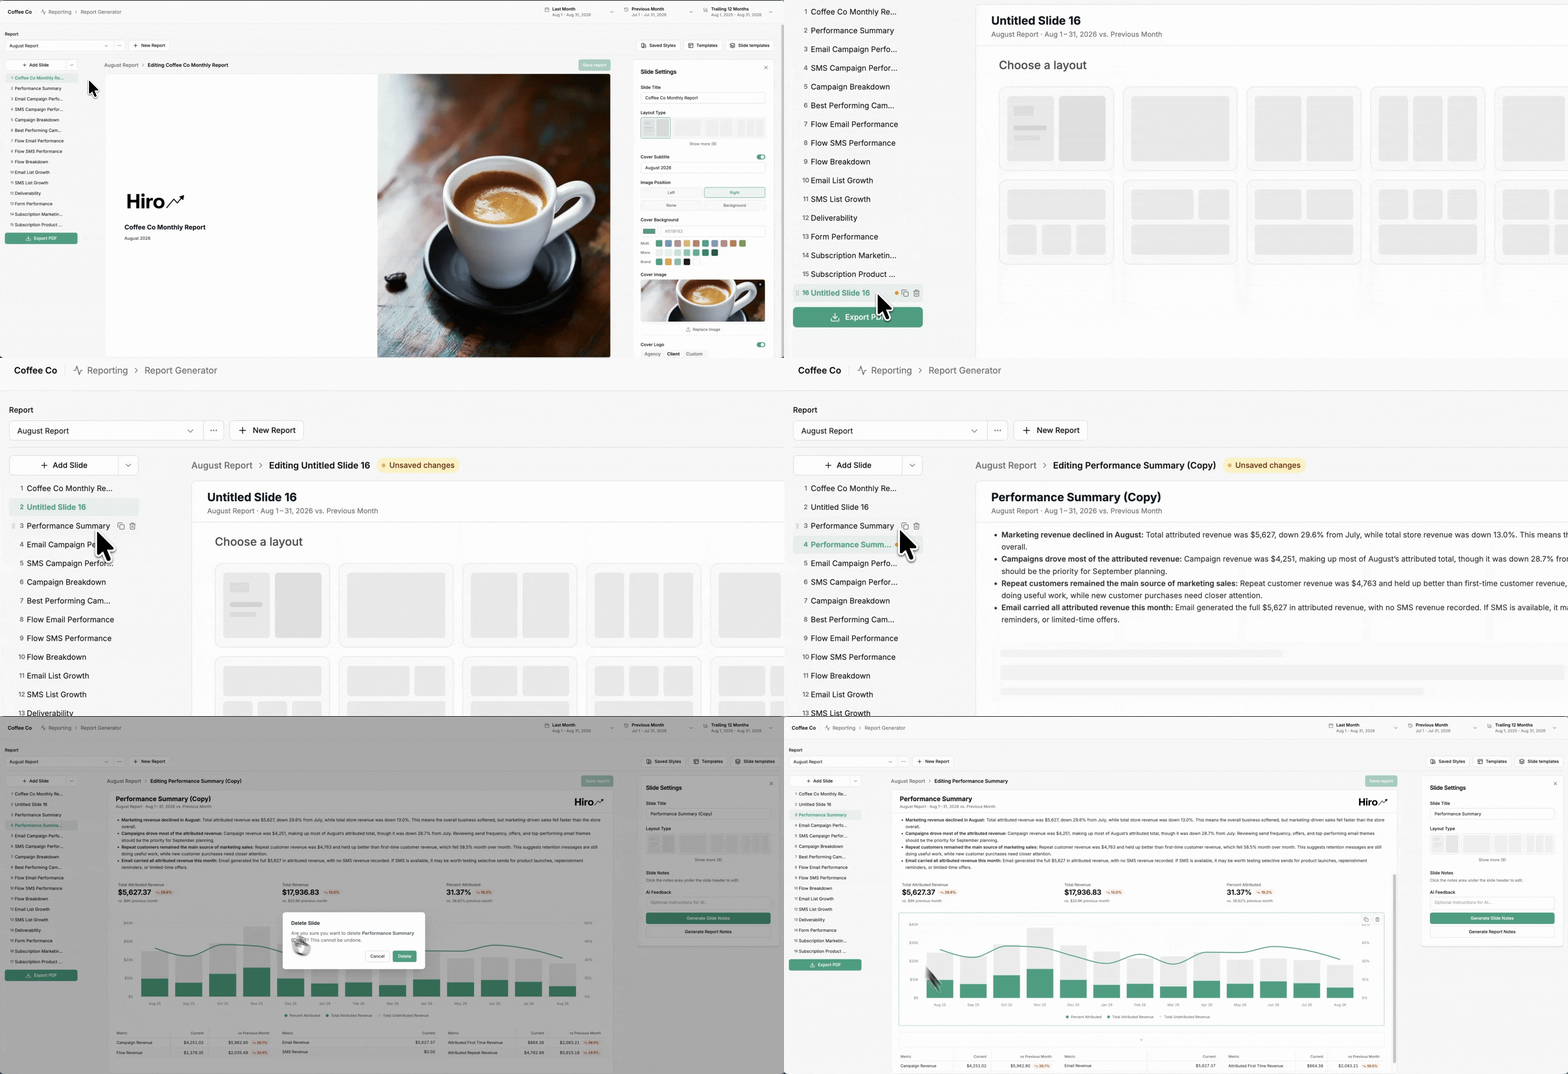
Add a slide: select Add Slide at the top of the slide list. A new slide is added using the current layout.
Reorder: drag slides in the list to change their order
Duplicate a slide: select the duplicate icon on the slide
Delete: remove a slide from the report
Each slide has a layout that controls how its components are arranged. Pick a layout from the layout picker in the slide editor.
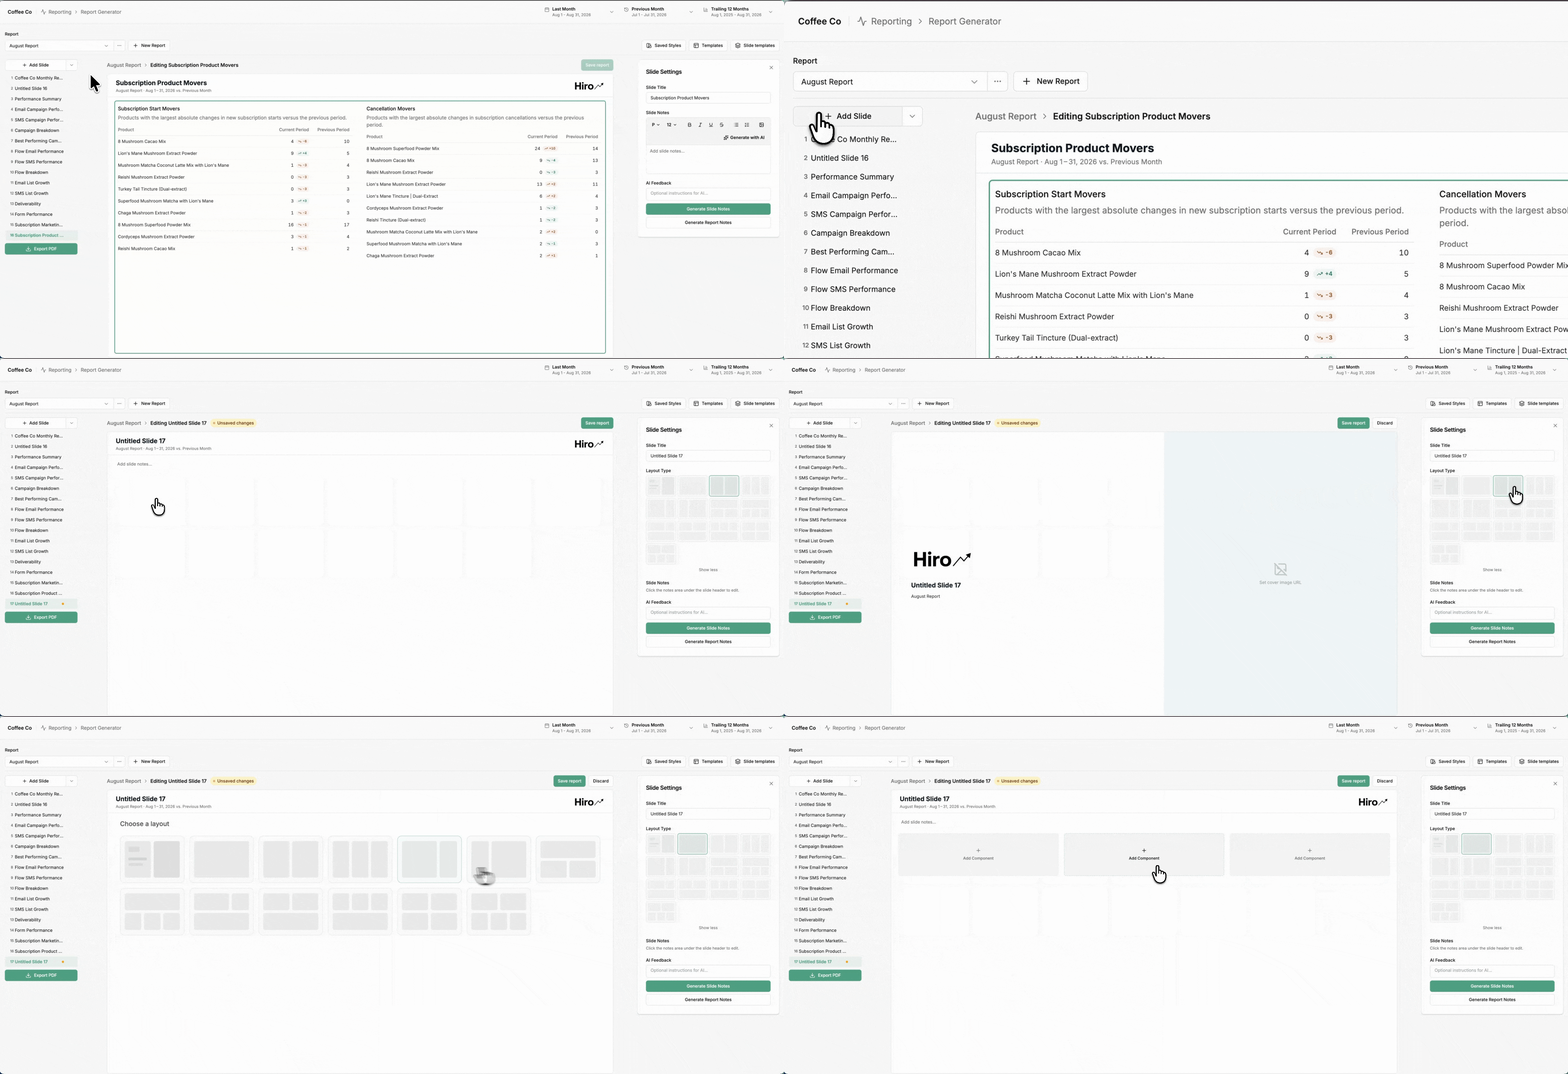
Select Show more in the layout picker to see all layouts. The layout you pick determines how the cards on that slide are displayed, and you can change it at any time without losing the components already on the slide.
Adding components
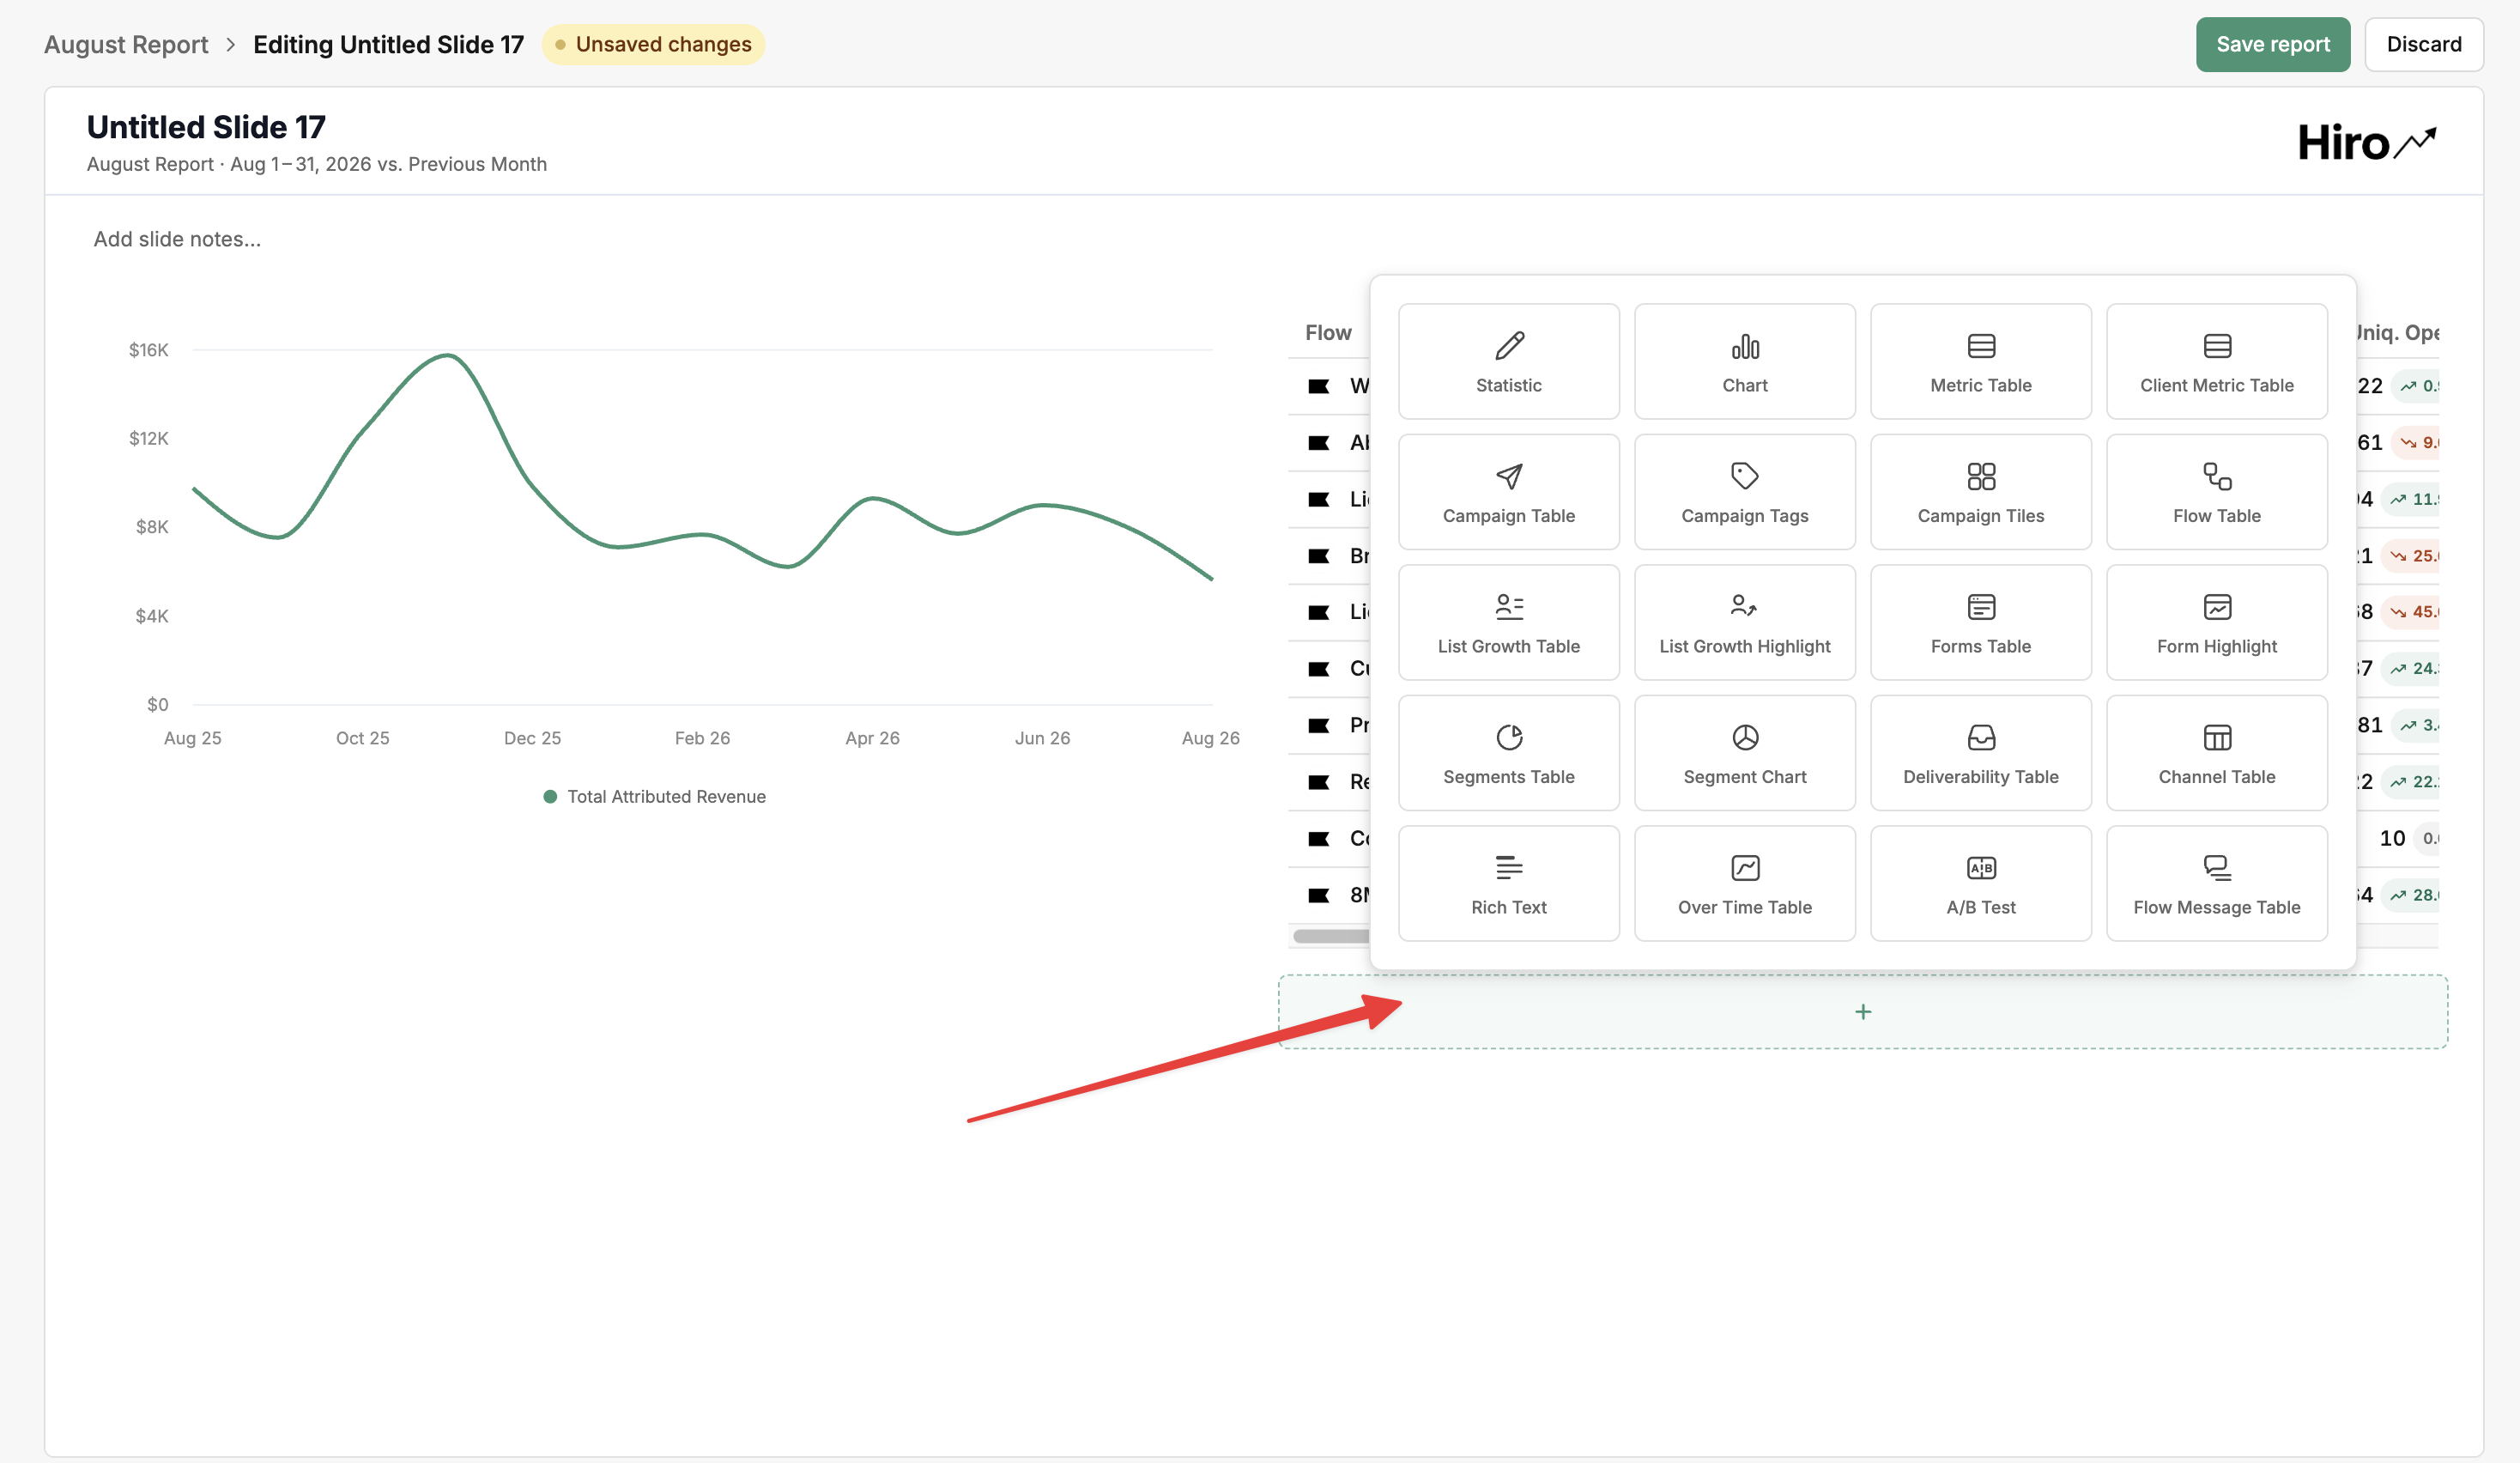
Inside a slide, select into a card and choose Add Component to open the component picker. Components are the charts, tables, and KPI cards that display your data — each one pulls live data based on the channels and metrics you select.
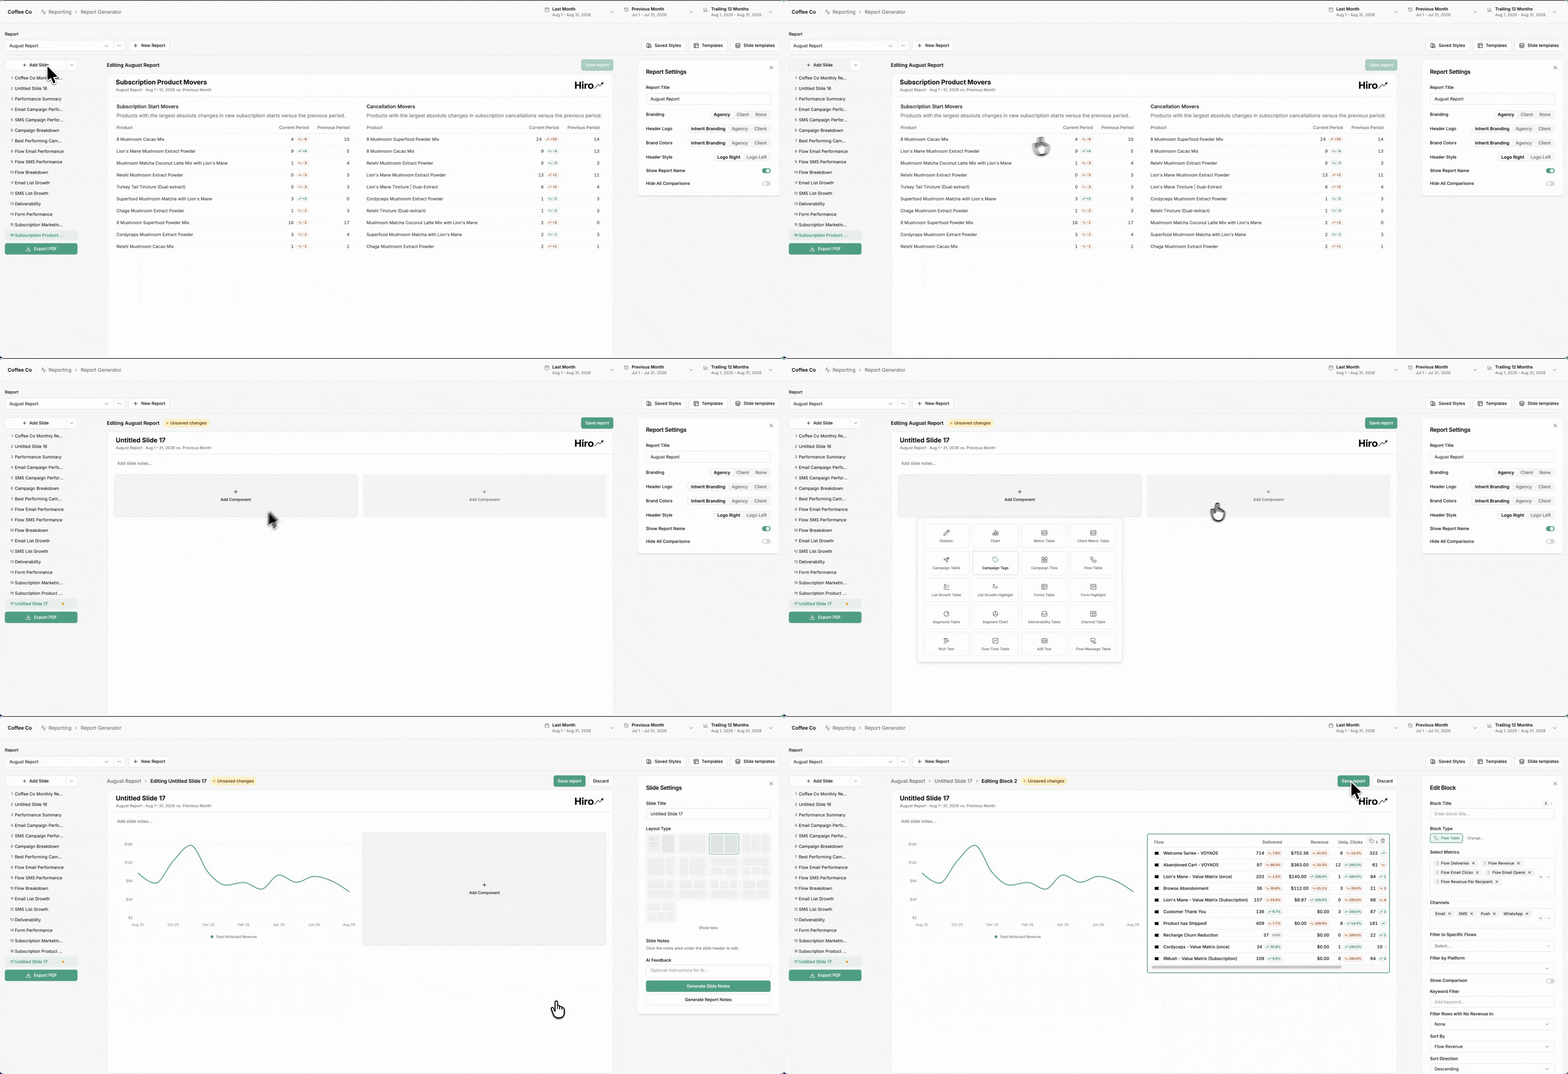
Available component types:
Component | What it shows |
|---|---|
Statistic | Big-number KPI card with optional comparison and sparkline |
Chart | Bar, line, combo, stacked, or segment-growth chart |
Metric Table | Metrics in a table with optional comparison |
Client Metric Table | Metrics compared across multiple clients in your agency, with optional currency conversion (native or convert to a common currency). Ideal for benchmarking clients against each other, or for brands with separate instances per locale — convert everyone to one currency to make the comparison apples-to-apples. |
Campaign Table | Campaign-level metrics |
Campaign Tags | Performance grouped by campaign tag |
Campaign Tiles | Top campaigns as tiles |
Flow Table | Flow-level metrics |
Flow Message Table | Individual flow message metrics |
List Growth Table / Highlight | Subscriber list growth over time |
Forms Table / Form Highlight | Form performance |
Segments Table / Segment Chart | Segment size and growth |
Deliverability Table | Deliverability metrics |
Channel Table | Performance split by channel (Email, SMS, Push, WhatsApp) |
Over Time Table | Metrics tracked over time — ideal for monthly reporting |
A/B Test | Experiment table or single A/B test highlight |
Rich Text | Narrative notes, headings, or commentary |
After picking a component, choose its metrics, channels, and (for charts) the chart type and then select Save. The component is added to the card on the slide.
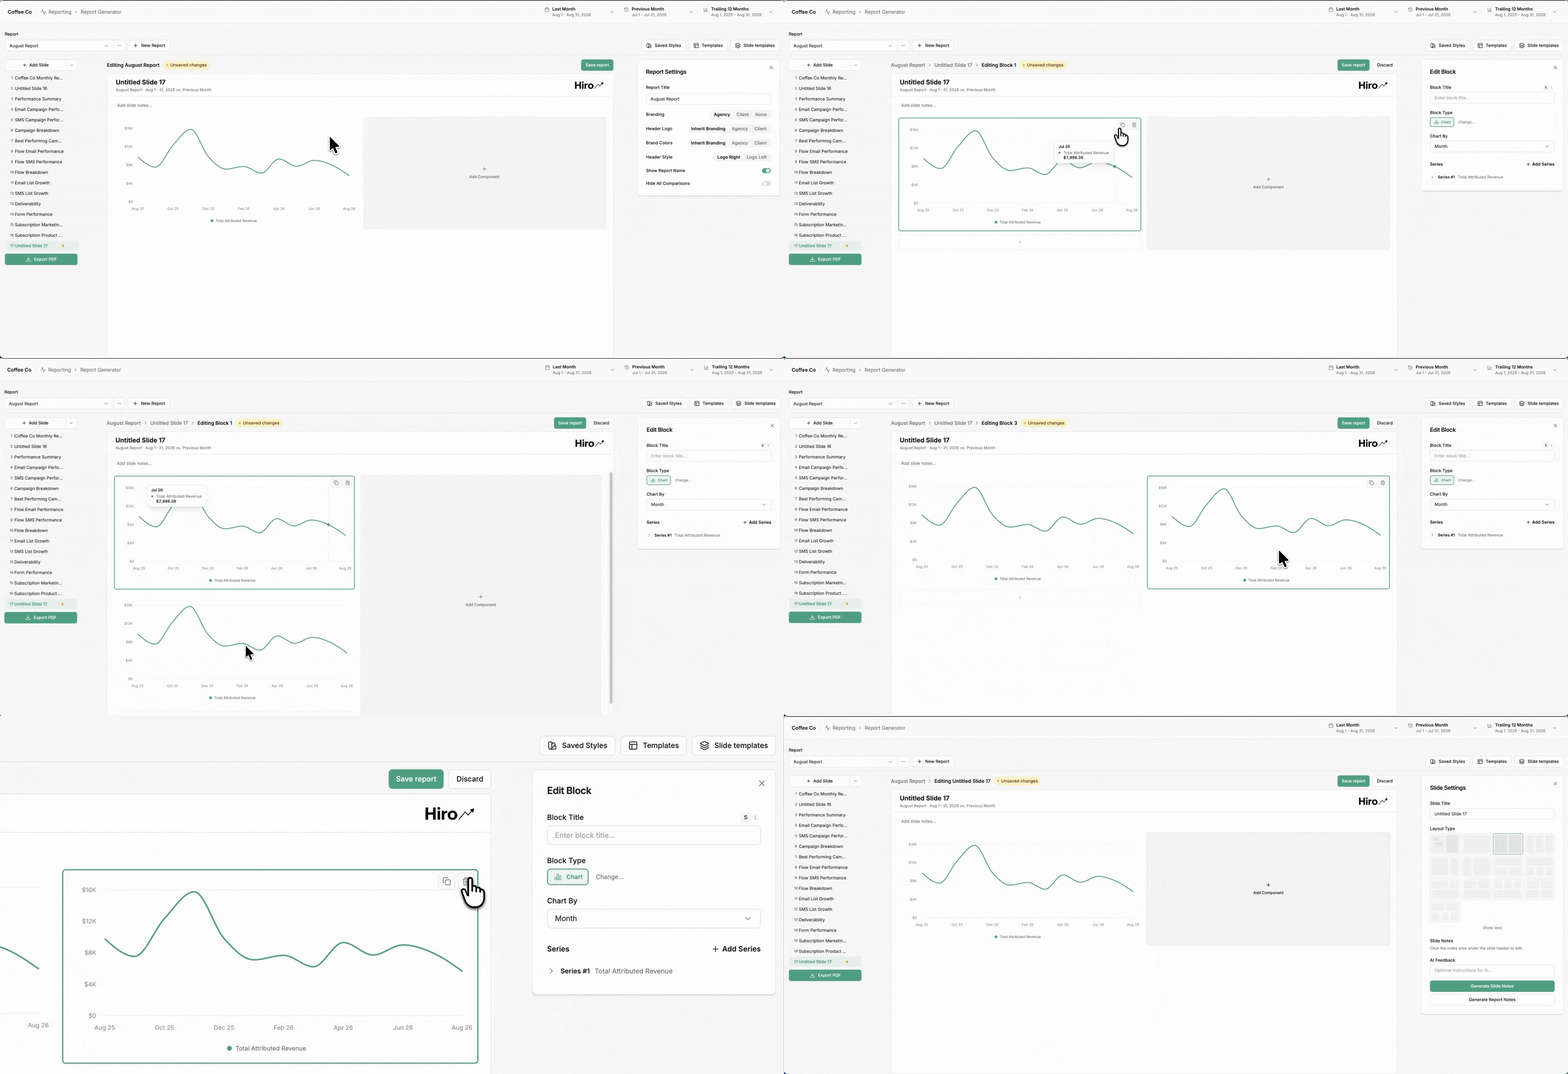
Hover over a card to reveal a + — select it to add more components to that slide. You can add as many components as you'd like, but keep in mind that slides don't scroll when exported. Respect the card's dimensions so everything fits cleanly and nothing overflows in the final PDF.
Hover over the right side of a component to reveal options to duplicate or delete it. Drag and drop a component to reposition it within the slide layout you selected — drop zones highlight as you drag so you can see where it will land.
Writing notes
Each slide has a notes zone where you can write the narrative for that slide — the key takeaways your client reads alongside the data.
Manual notes: type directly into the rich text editor. You can format text, add images, and structure the narrative however you want.
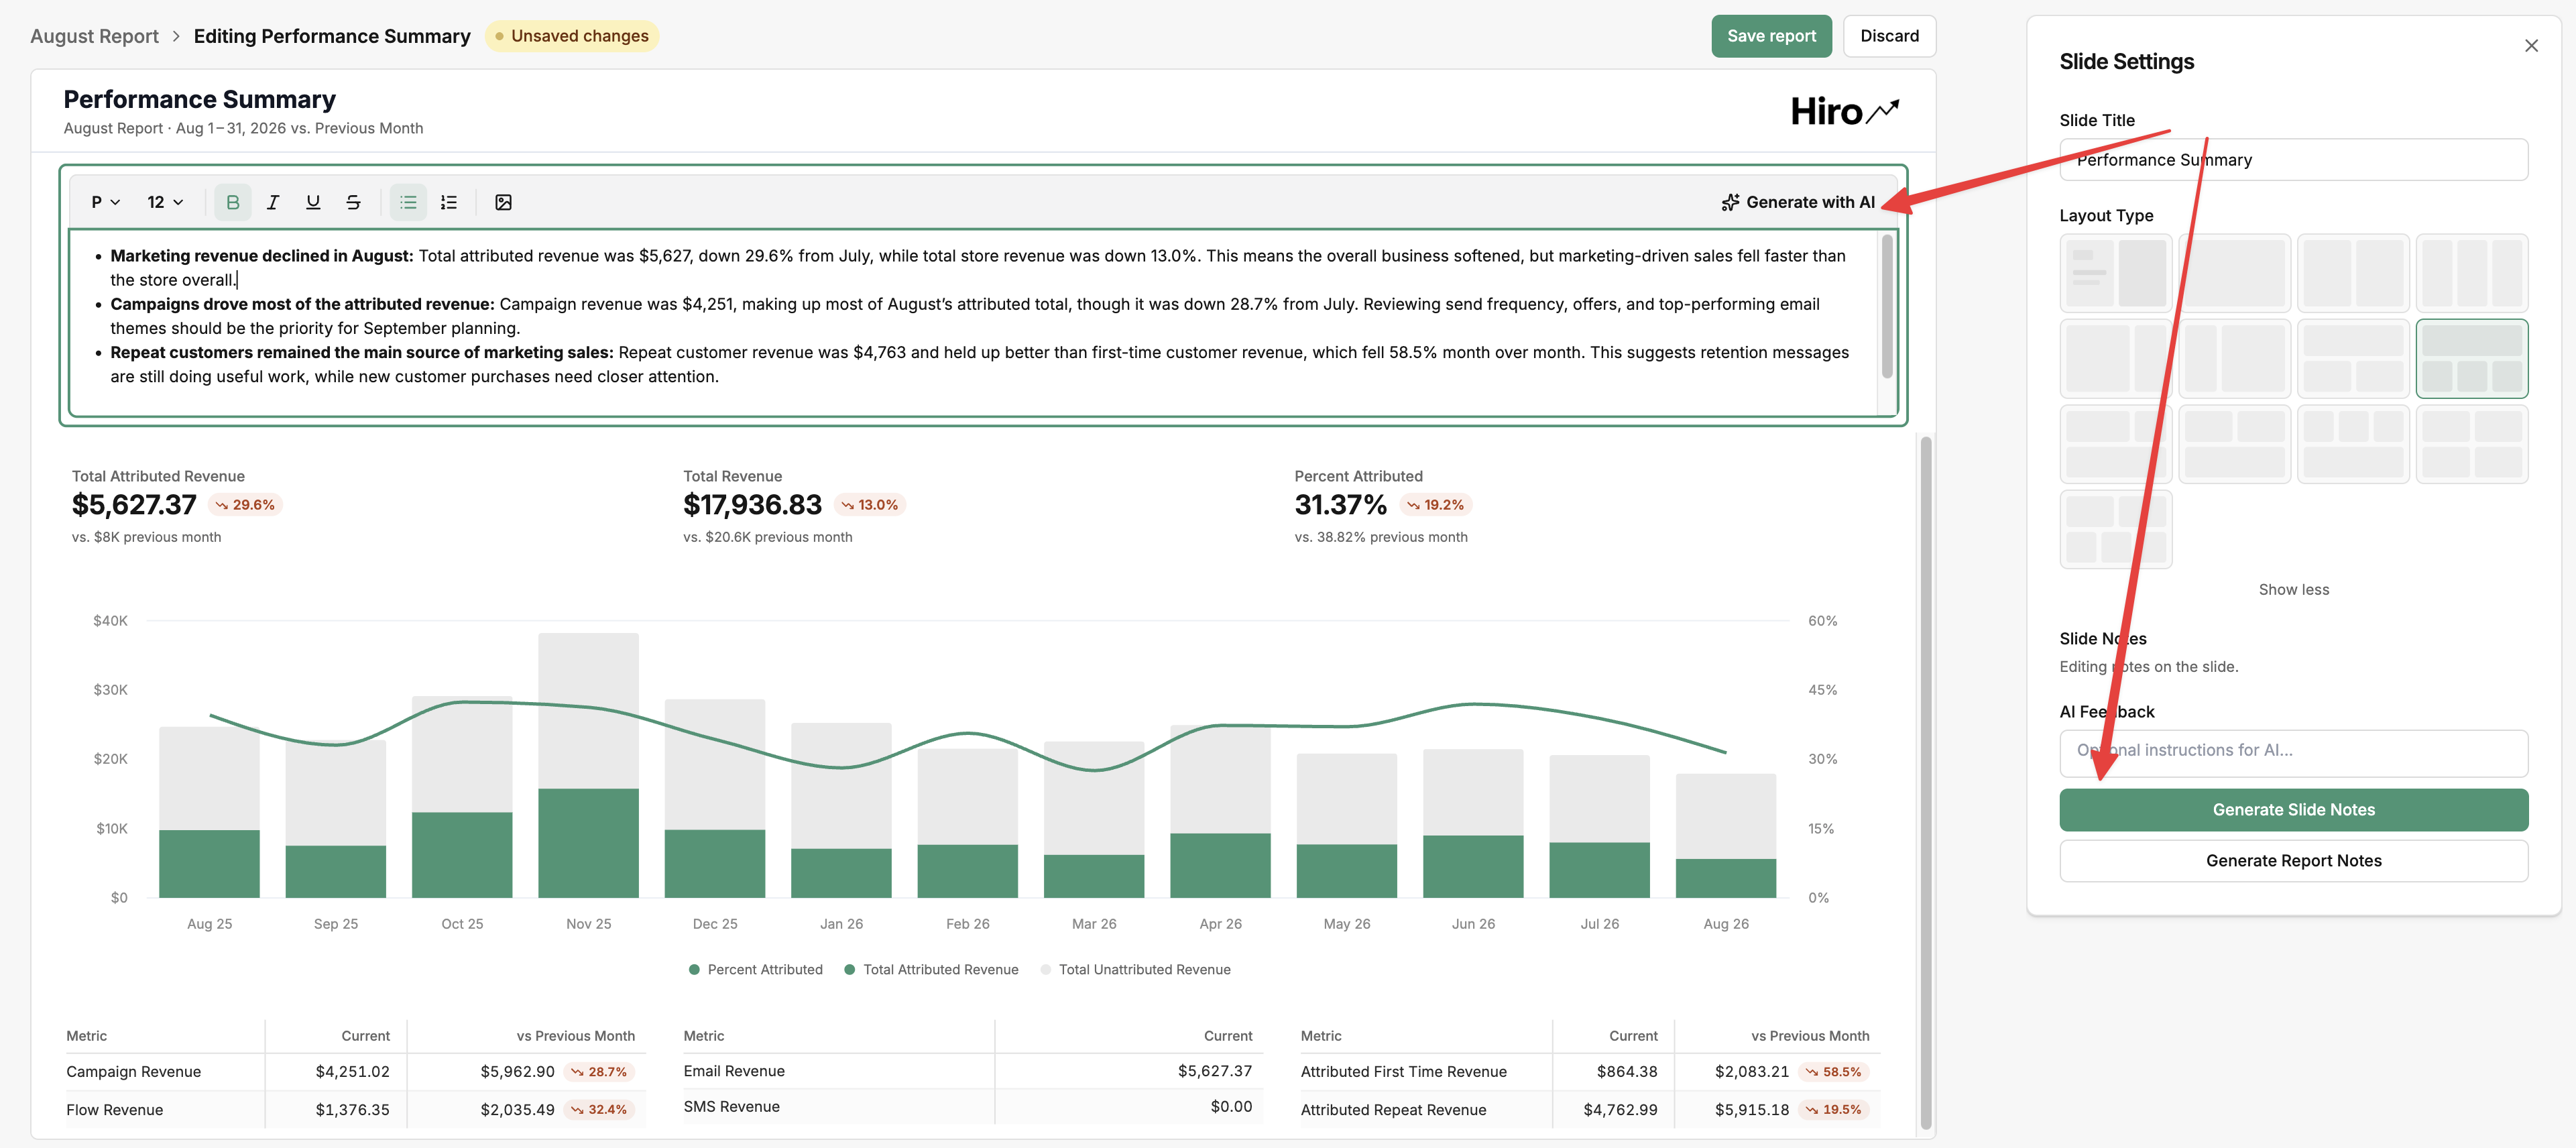
AI-generated notes: select Generate with AI or Generate Slide Notes to have Hiro draft a plain-language summary straight from the data on the slide. Tweak the text until it sounds like you using the AI Feedback textbox.
Report summary: use Generate Report Notes to draft a summary across the whole report, not just one slide.
When notes push your charts off the slide
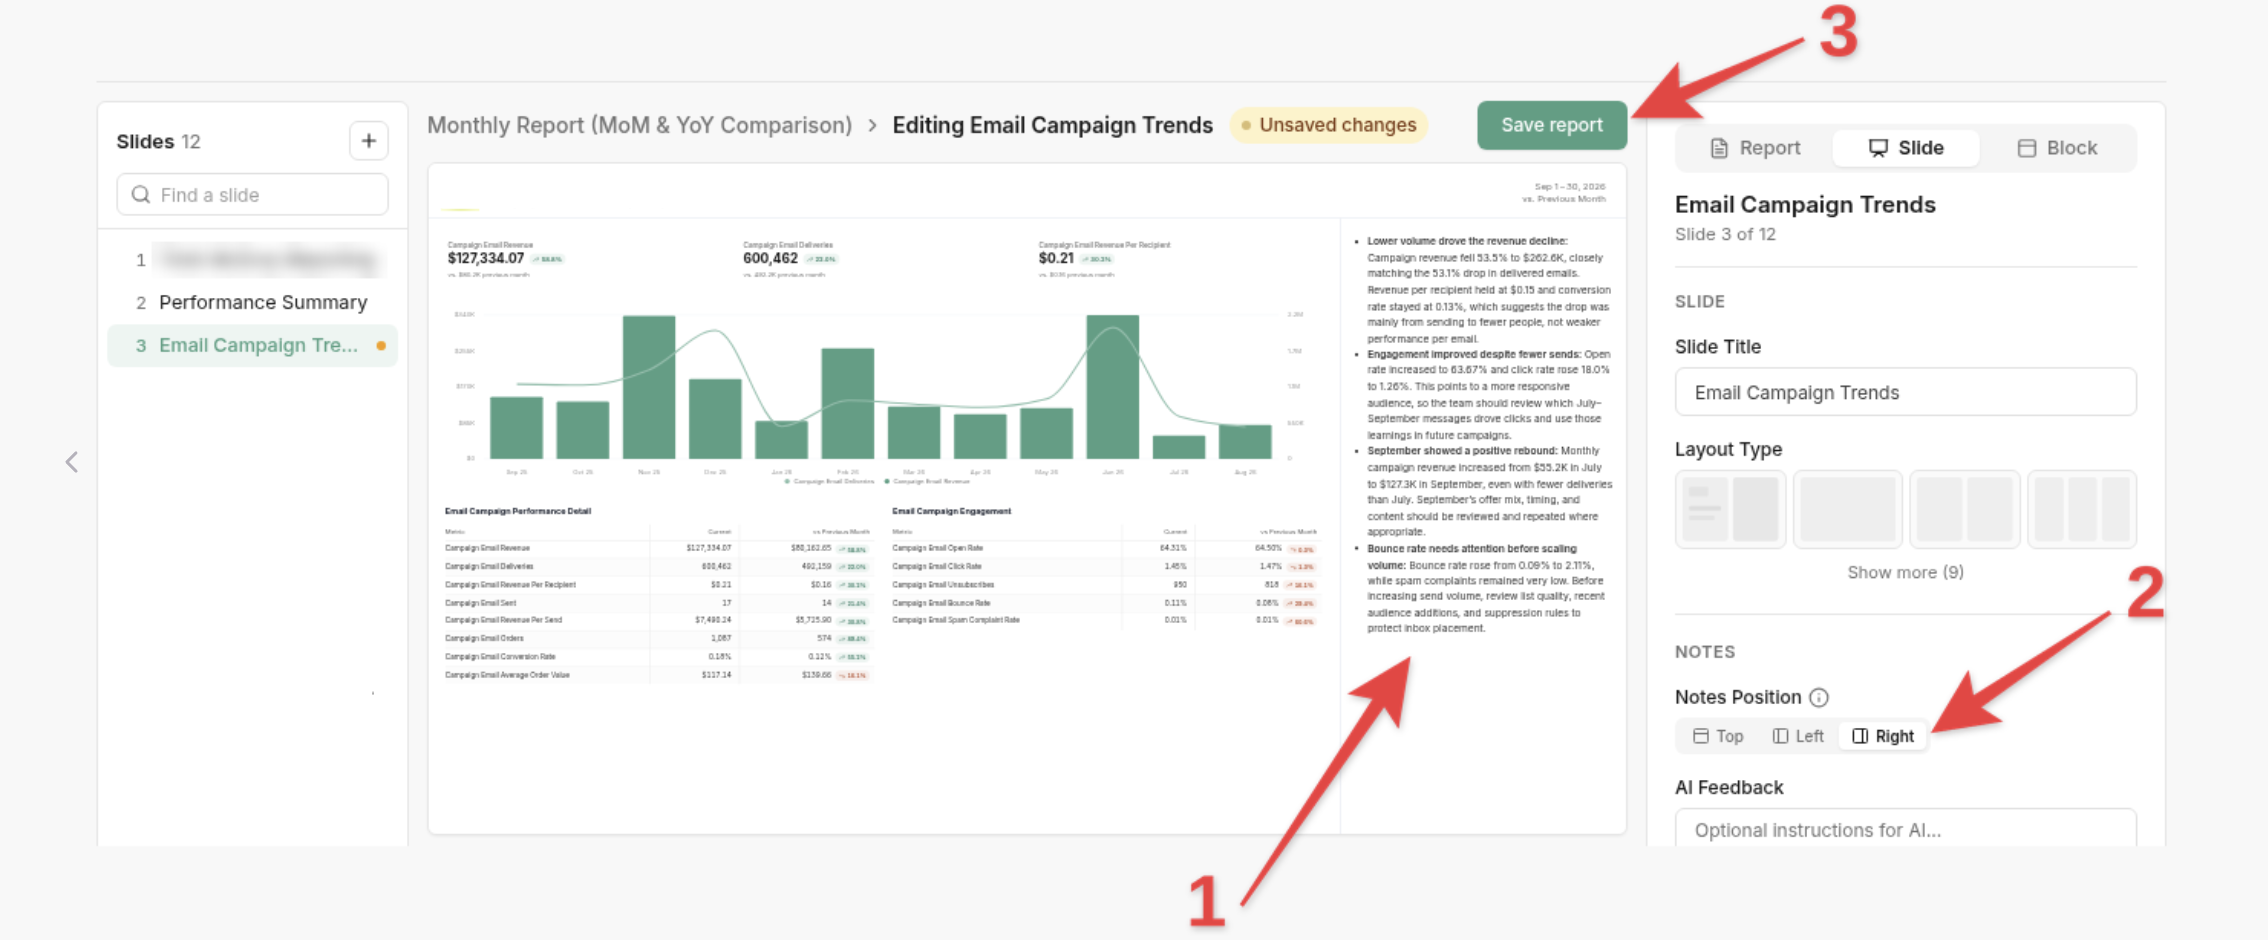
Every exported slide is a fixed size, so long notes above your charts can push them past the bottom of the page. If that happens, a yellow notice shows under the slide preview: “This slide is cut off at the bottom and will export that way.” What you see in the editor is what the PDF will look like.
To fix it, move the notes beside the charts. Either:
Click Left or Right in the notice, or
Open the Slide tab and pick Left or Right under Notes Position.
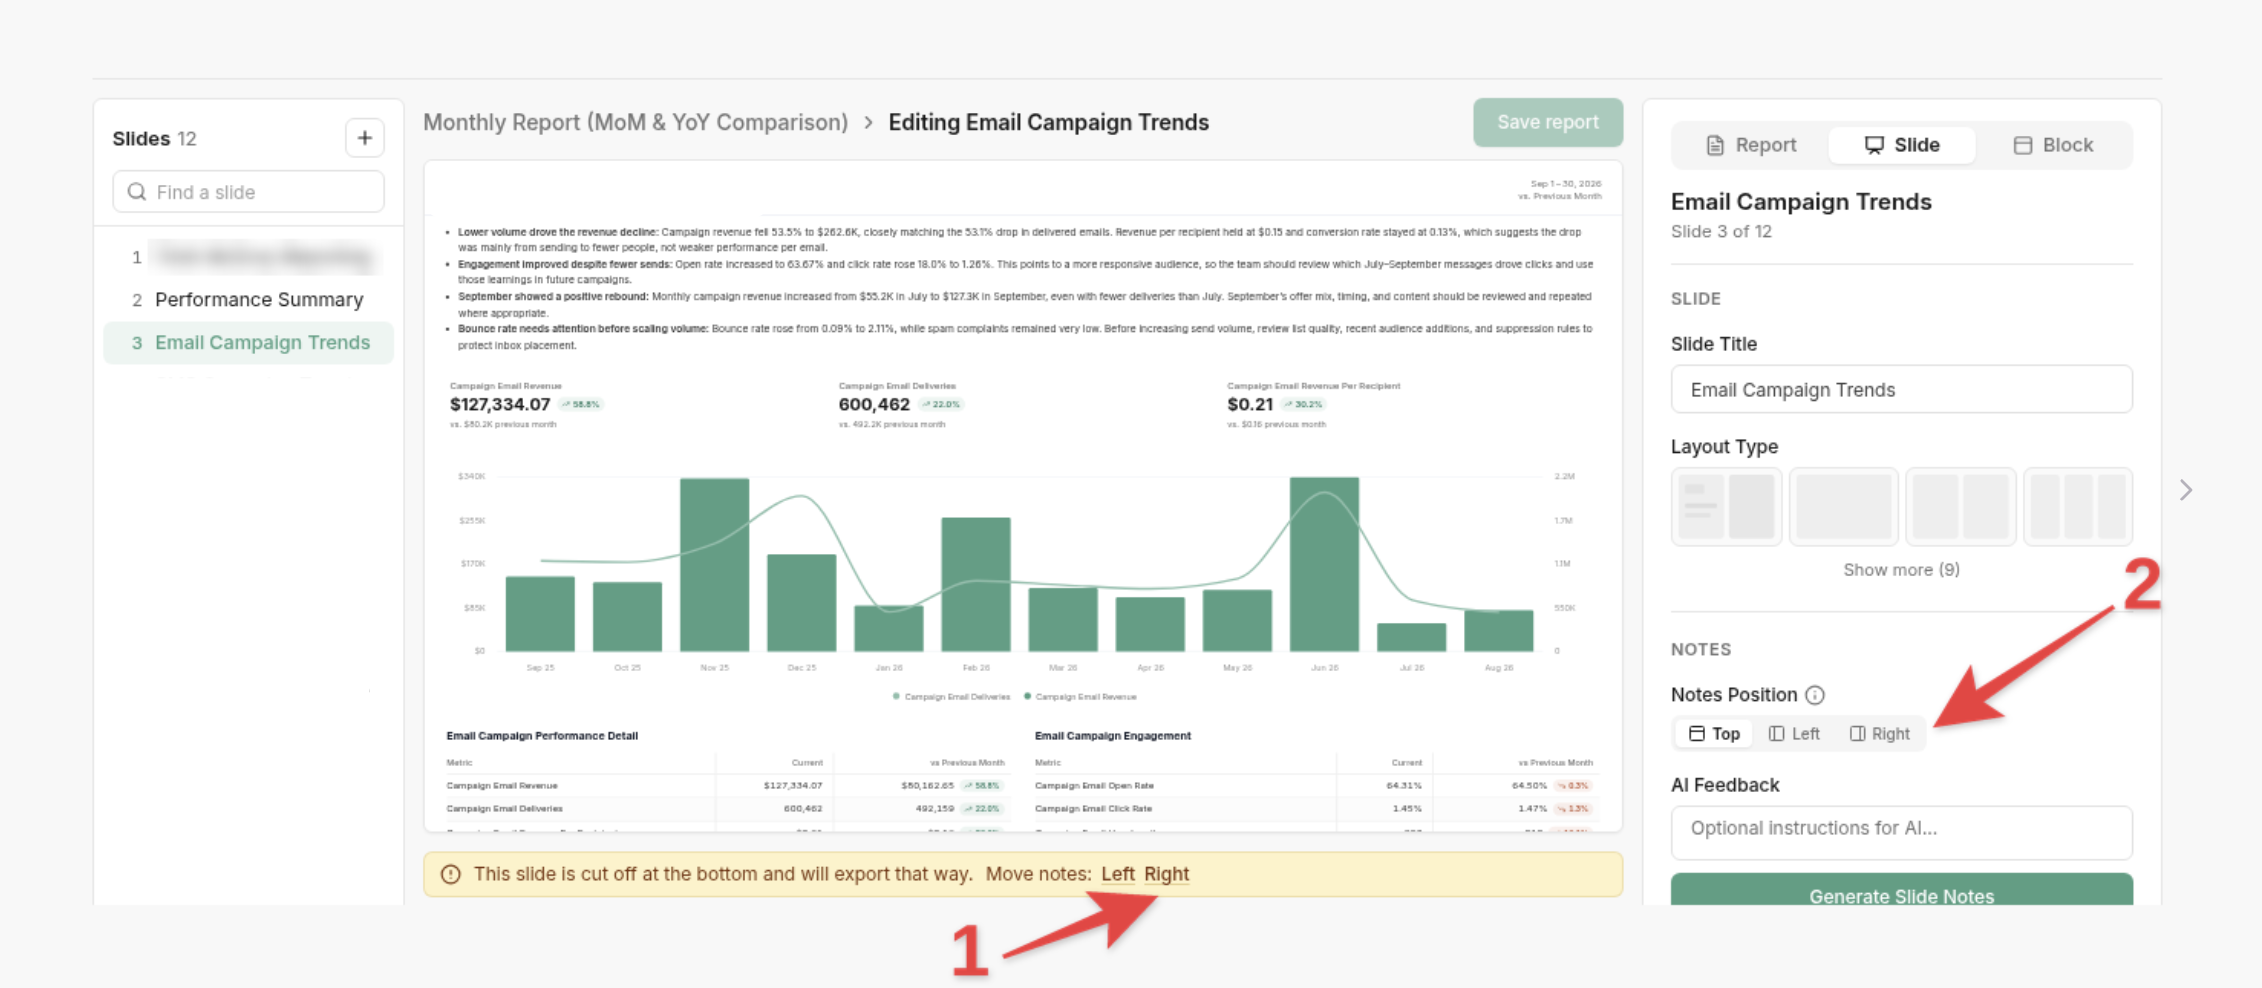
The notes move into a column beside your blocks (1). The charts and tables shrink slightly to fit beside them and keep their proportions. Notes Position shows the side you picked (2). Click Save report (3), and the export will match the editor.
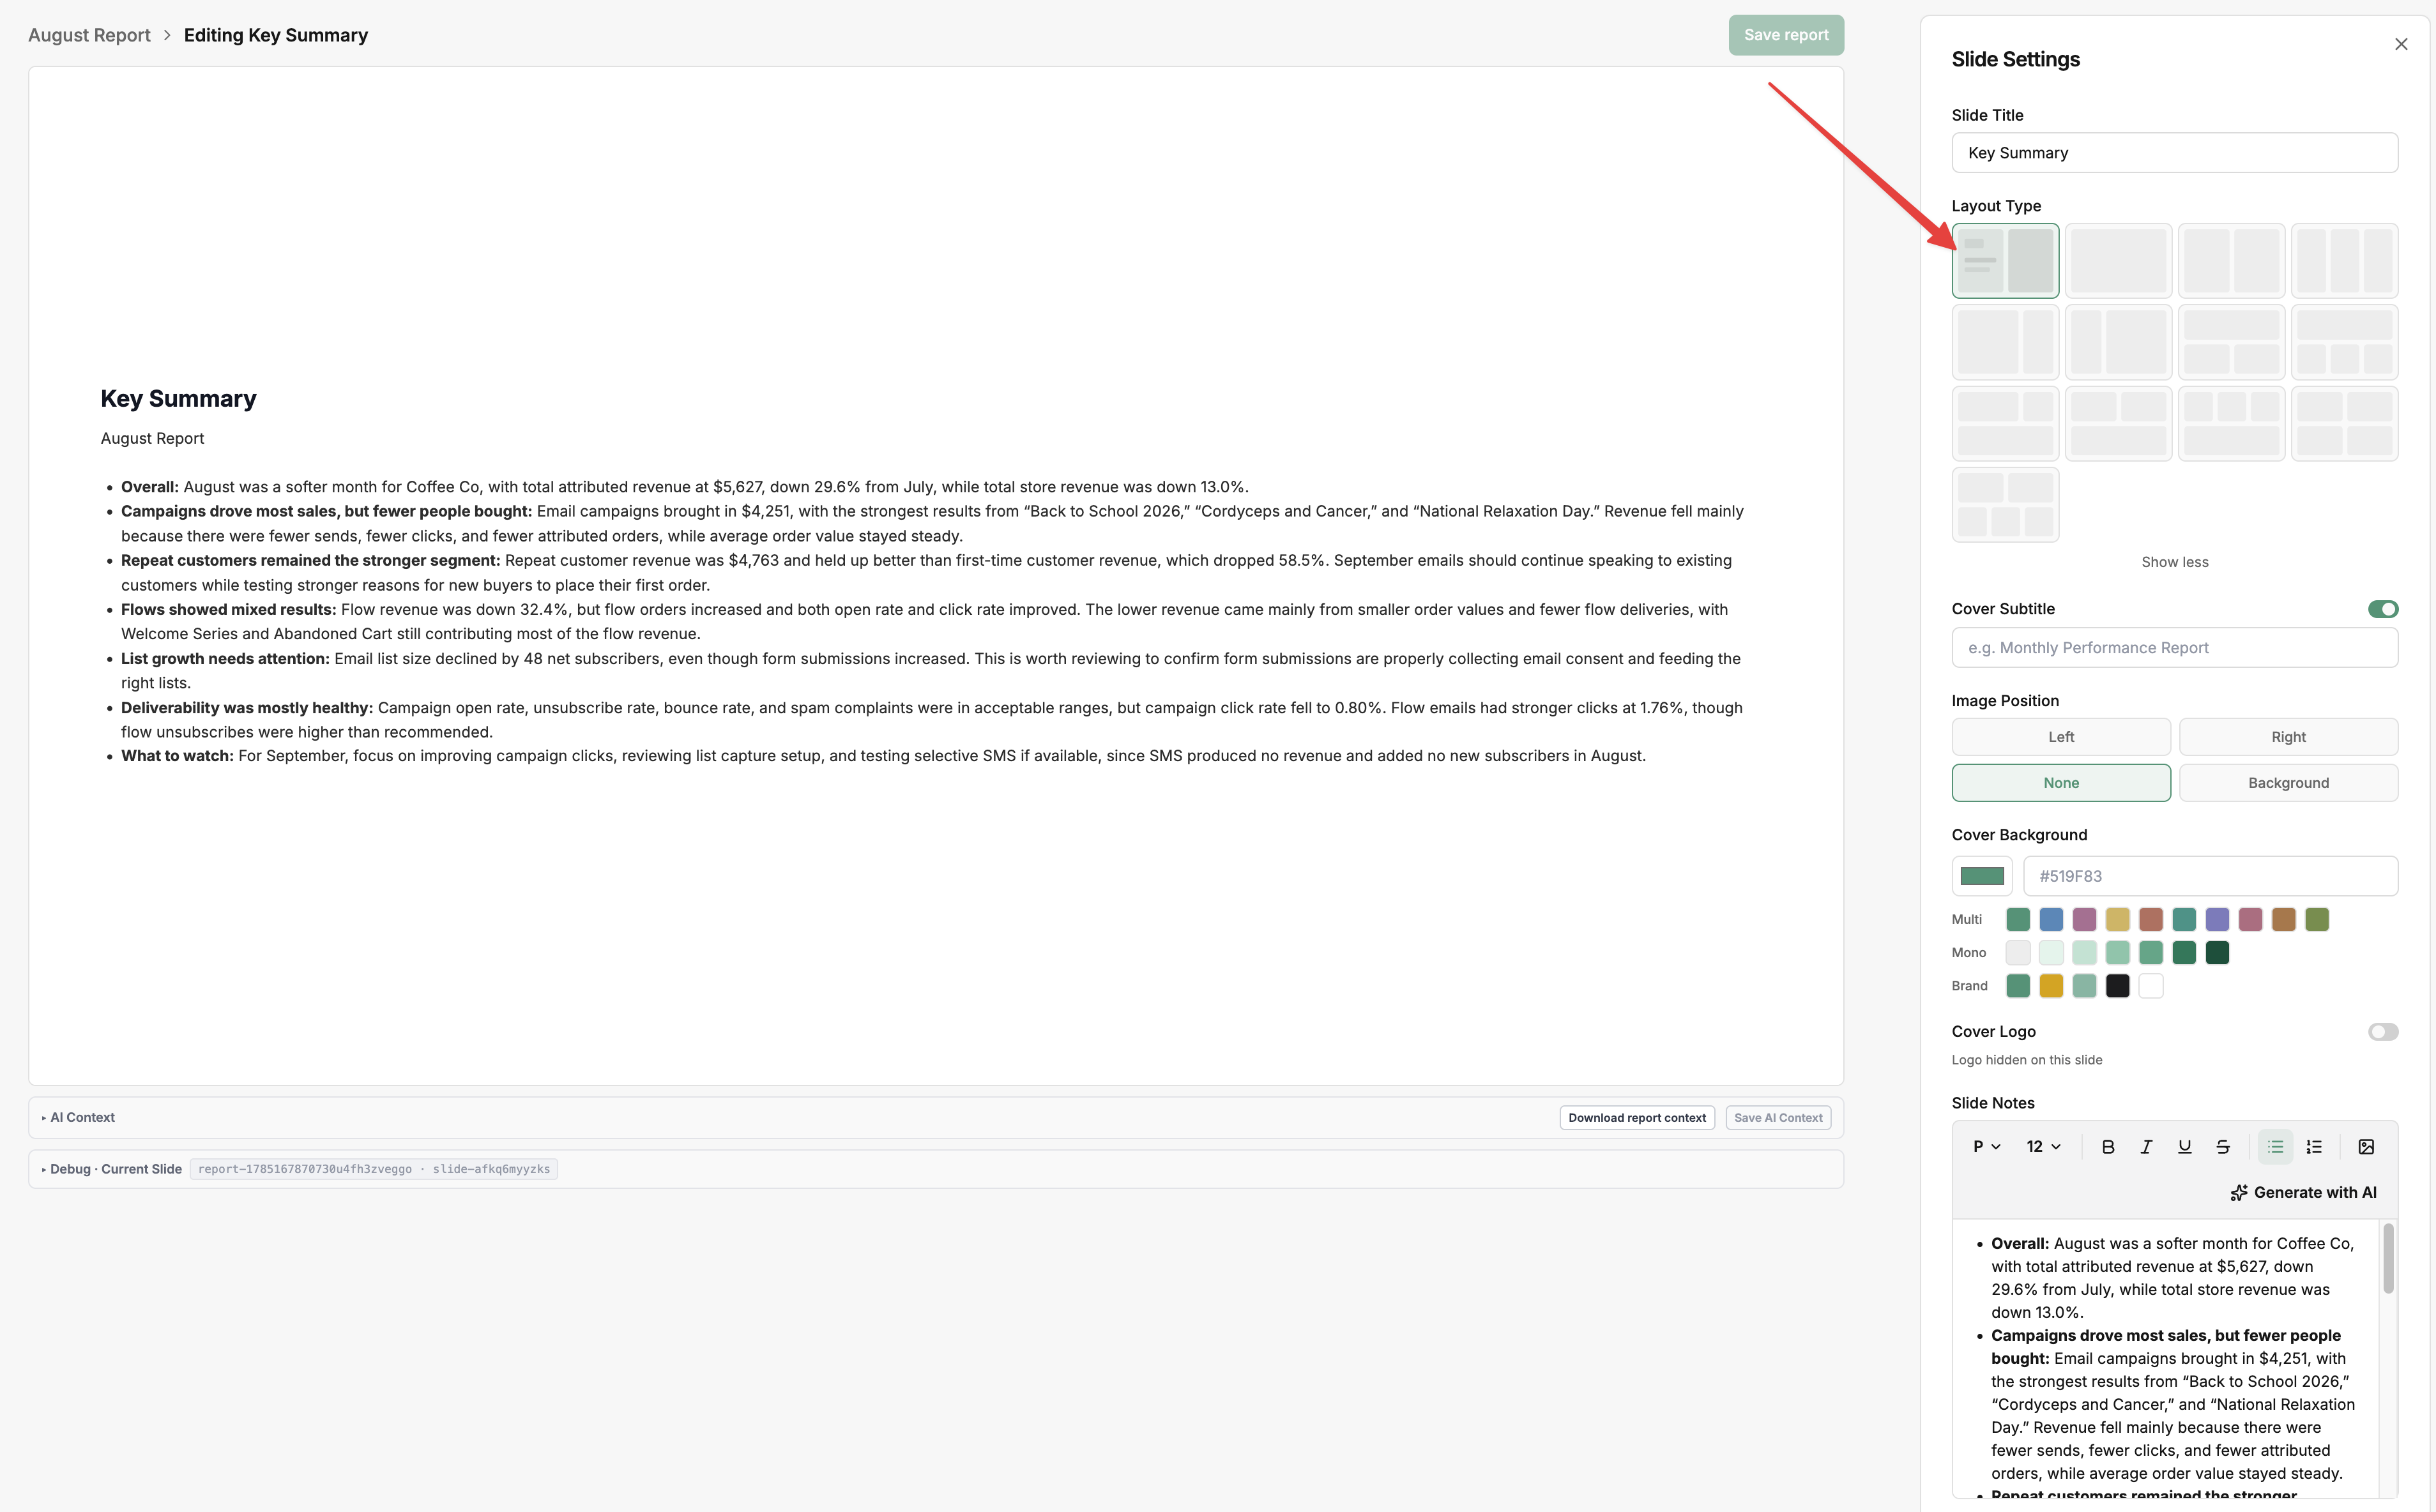
Existing slides keep their notes on top until you change them. If a slide is still cut off after moving the notes (usually one with a lot of tables), move a block onto its own slide. For a slide that’s mostly text, set its layout to Cover Slide, remove the cover image and turn off the cover logo, then put your content in the Slide Notes text box.
Notes save with the slide, so they're always there when you reopen the report or export it. Keep in mind that notes are static — they're tied to the slide, not to the data. If you change the time frame with the date picker, the numbers on the slide update but the notes you wrote don't, so you'll need to edit them manually to match.
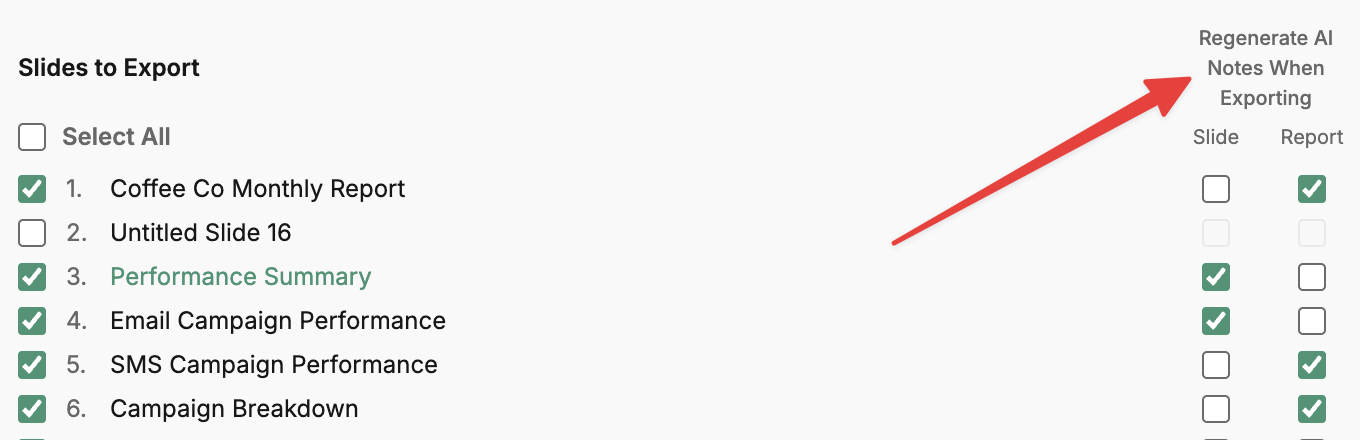
The exception is scheduled exports. When you set up a schedule, each slide has a Regenerate AI Notes When Exporting toggle — turn it on and Hiro regenerates the AI notes from the latest data each time the export runs, so the narrative stays current without you touching it.
This only applies to AI-generated notes on an automated schedule; written notes done within the Report Generator are always left as you wrote them.
Using AI Context
AI Context is background context you give Hiro so its generated notes sound like your agency and reflect your client's goals. It's a collapsible drawer under the slide canvas with four scopes:
Scope | Where it applies | Example |
|---|---|---|
Agency | Across all your agency's reports | "Our agency prioritizes retention and repeat purchase rate over short-term revenue spikes." |
Client | Across this client's reports | "This client is focused on growing first-time buyers while protecting margin." |
Report | Only for this report | "This report should focus on new product launch performance." |
Slide | Only when generating notes for this slide | "Mention that this slide excludes recurring subscription orders." |
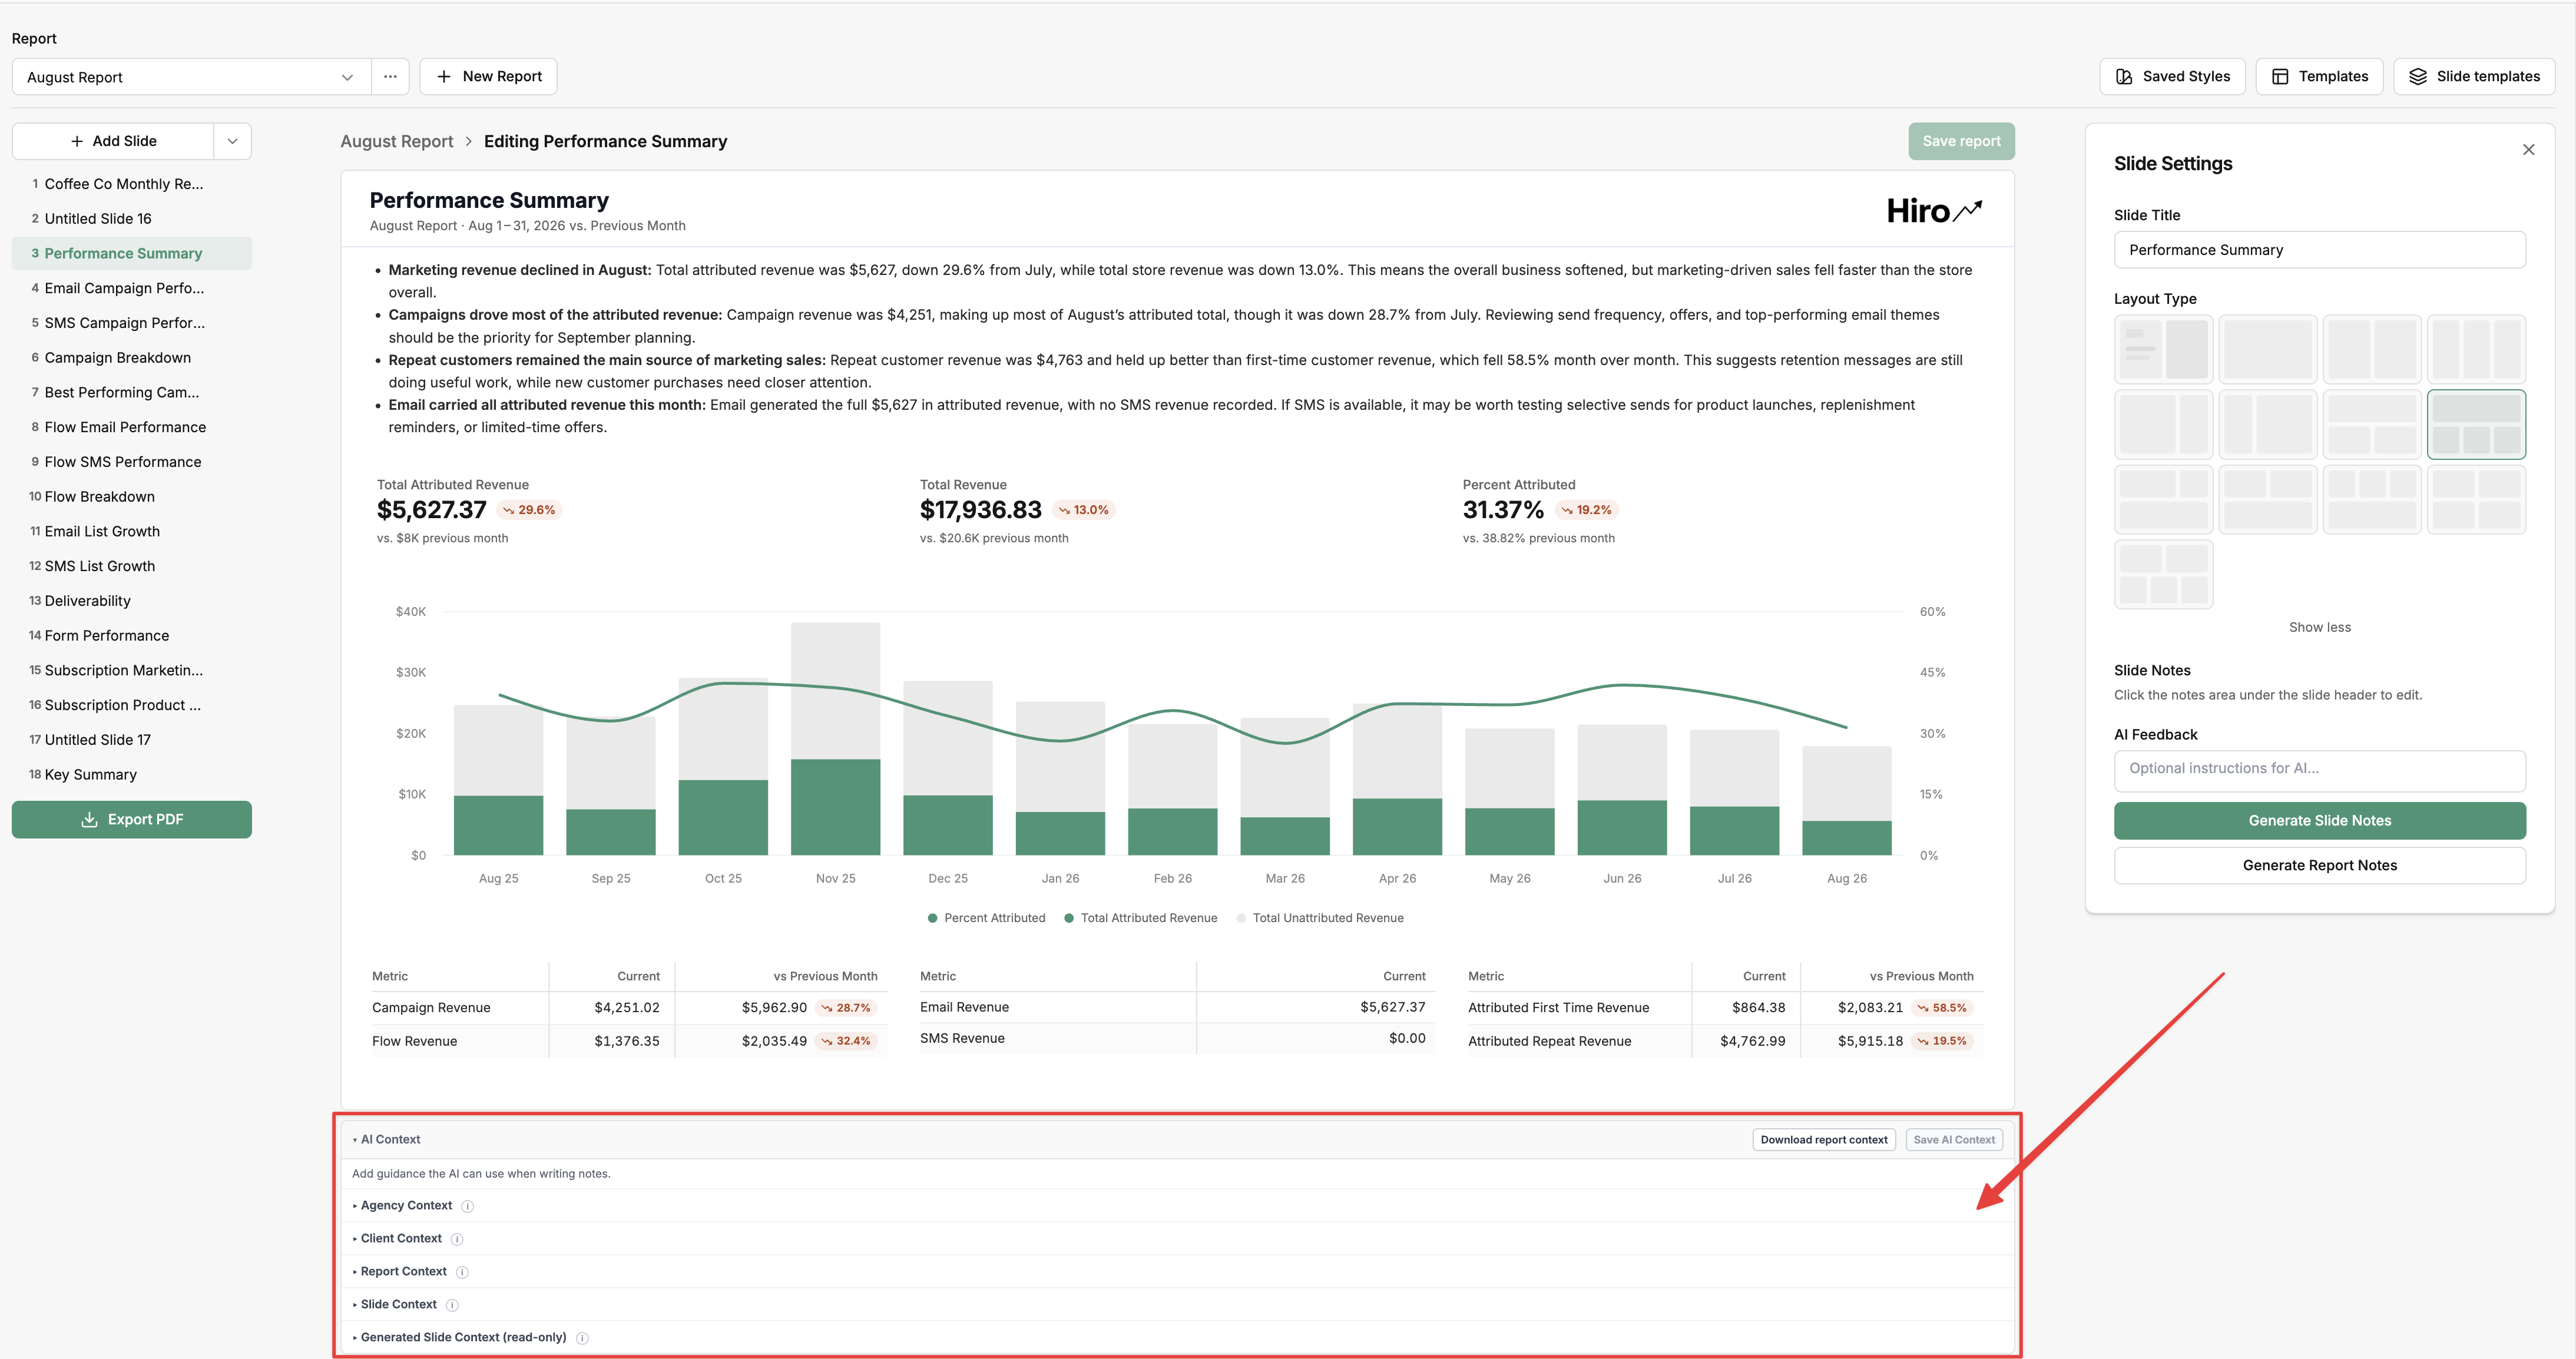
Type into any of the scopes, then select Save AI Context. Hiro combines all four scopes (agency + client + report + slide) when generating notes for a slide, with the narrower scopes layered on top of the broader ones.
Changing styles: agency vs. client
Reports inherit branding from your agency and client settings, but you can override it per report.
Setting the branding source
Report settings (⋯ menu → Report settings) the Branding control lets you pick where the logo and colors come from:
Inherit Branding — use whatever the report is set to (default).
Agency — use your agency's logo and brand colors.
Client — use the client's logo and brand colors.
Editing the underlying styles
To edit the agency or client branding that reports inherit from, select Saved Styles in the top bar. The styles dialog lets you pick a Style Scope — Agency or Client — and edit the branding (logo, colors, fonts) for that scope. Changes here flow through to every report that inherits from that scope.
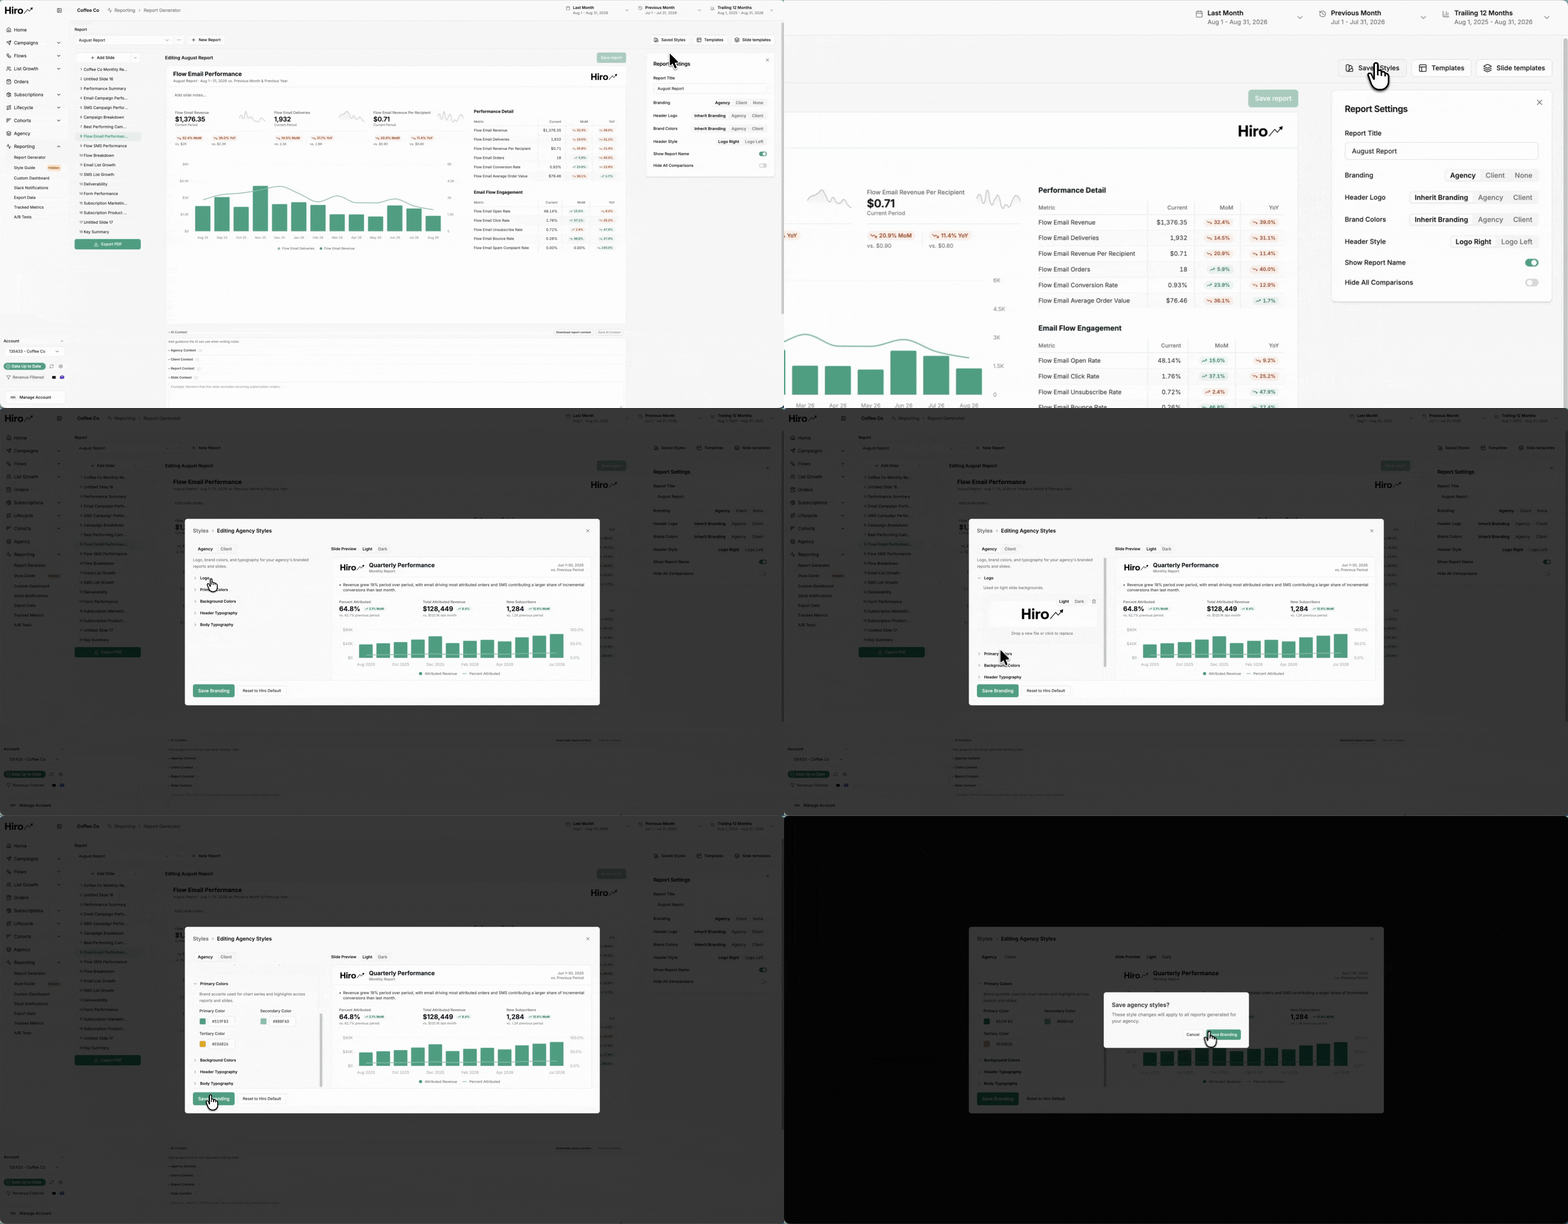
Set up your agency branding once in Account Settings and your client branding in Client Settings, and every report inherits automatically — you only need to override when you want something different.
Where to access templates

There are two kinds of templates, accessed from two buttons in the top bar:
Templates (report templates) — full multi-slide report layouts. Use these to start a new report from a proven layout, or to save a finished report as a reusable starting point for other clients.
Slide templates — individual slide layouts you can insert into any report. Use these when you've built a single slide you want to reuse (e.g. a standard cover or a recurring KPI slide) without saving the whole report.
Both the Templates and Slide templates dialogs are split into two tabs:
Team — templates your agency has saved. These are the ones you and your teammates (with edit access) can update or delete. This is the default tab when you open the dialog, so it's where your own work lives. New templates you save appear here.
Hiro — built-in templates provided by Hiro (like the Hiro Default report). You can import these into any report, but they're read-only — you can't overwrite or delete a Hiro template. If you want to customize a Hiro template, import it into a report first, then save your modified version as a new team template.
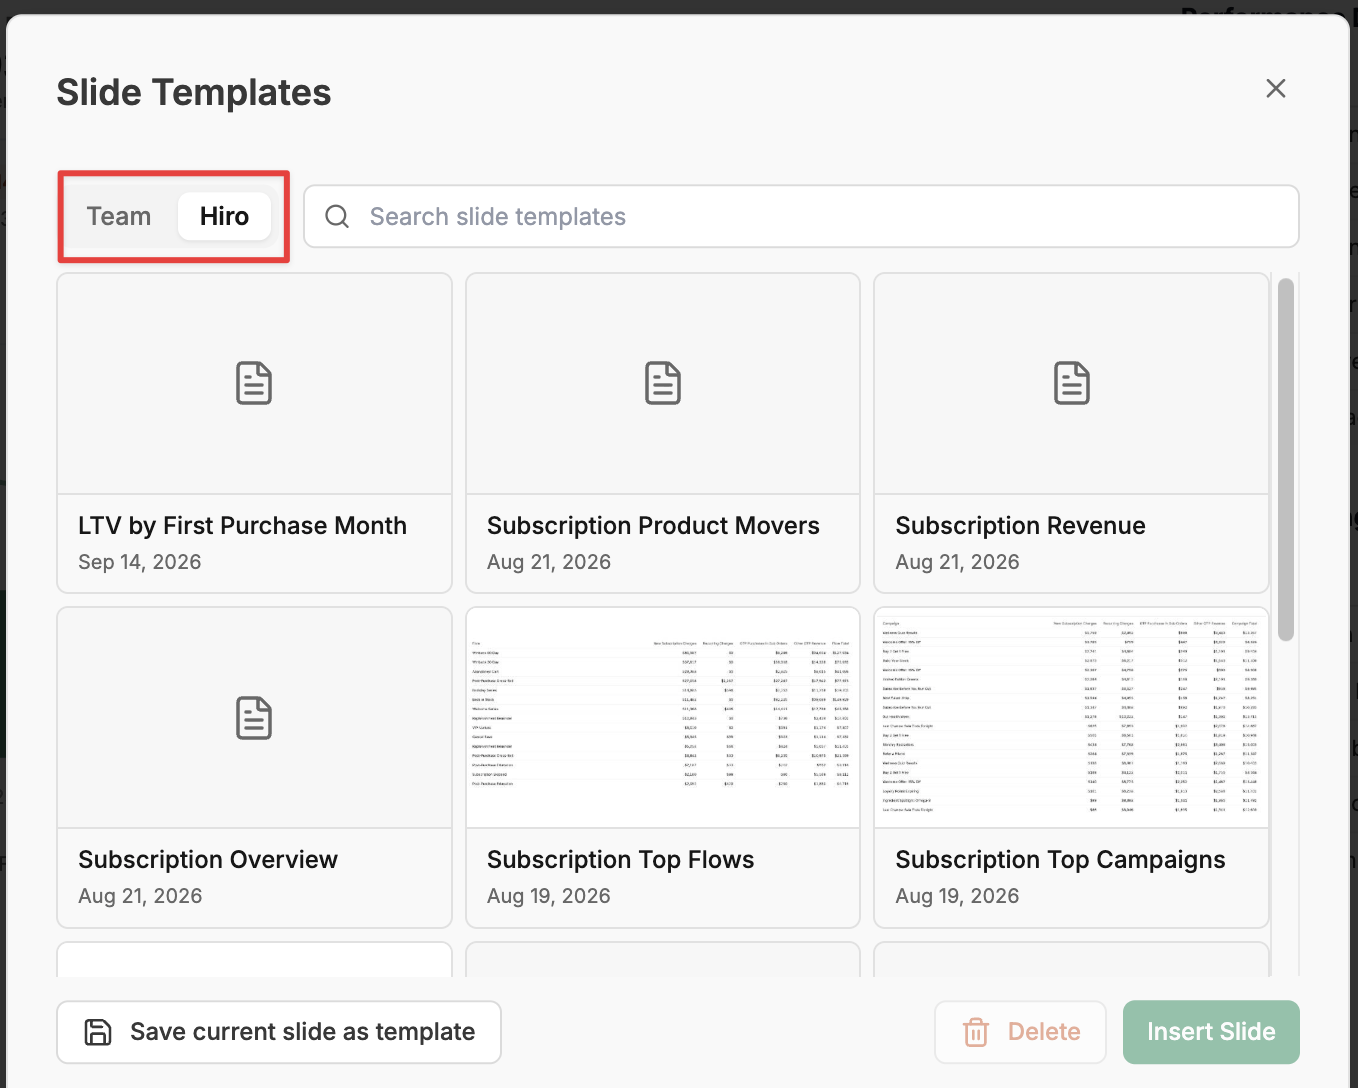
Both tabs are searchable and sorted by most recently updated. New client reports start from the Hiro Default template automatically, so every new client has a working starting point before you've built anything.
Report Templates
Save a report as a template: select Templates → Save Current as Template, name it, and choose whether other team members can view and edit it. The template is saved at the agency level.
Update an existing template: select Templates → Update Existing, pick the template, and select Update. The template is overwritten with your new changes. Note: updating a template does not automatically push those changes to reports that already had the previous version applied — you'll need to re-import the updated template into each report.
Import a template into a report: select Templates, pick the template from the dropdown, and confirm. The template's slides load into the editor as a new report.
When you save a report as a team template, Hiro strips out client-specific picks like forms, segments, and flows so the template renders cleanly for any client. You'll re-pick those per report when you reuse it.
Slide Templates
Save a slide as a template: from the slide's options, choose to save it as a slide template. Name it and choose sharing.
Insert a slide template: select Slide templates and pick the one you want to insert into the current report.
Delete a slide template: from the slide templates dialog.
Exporting reports
You can export a report to PDF on demand, or put it on a schedule so Hiro generates and sends it automatically.
Export on demand
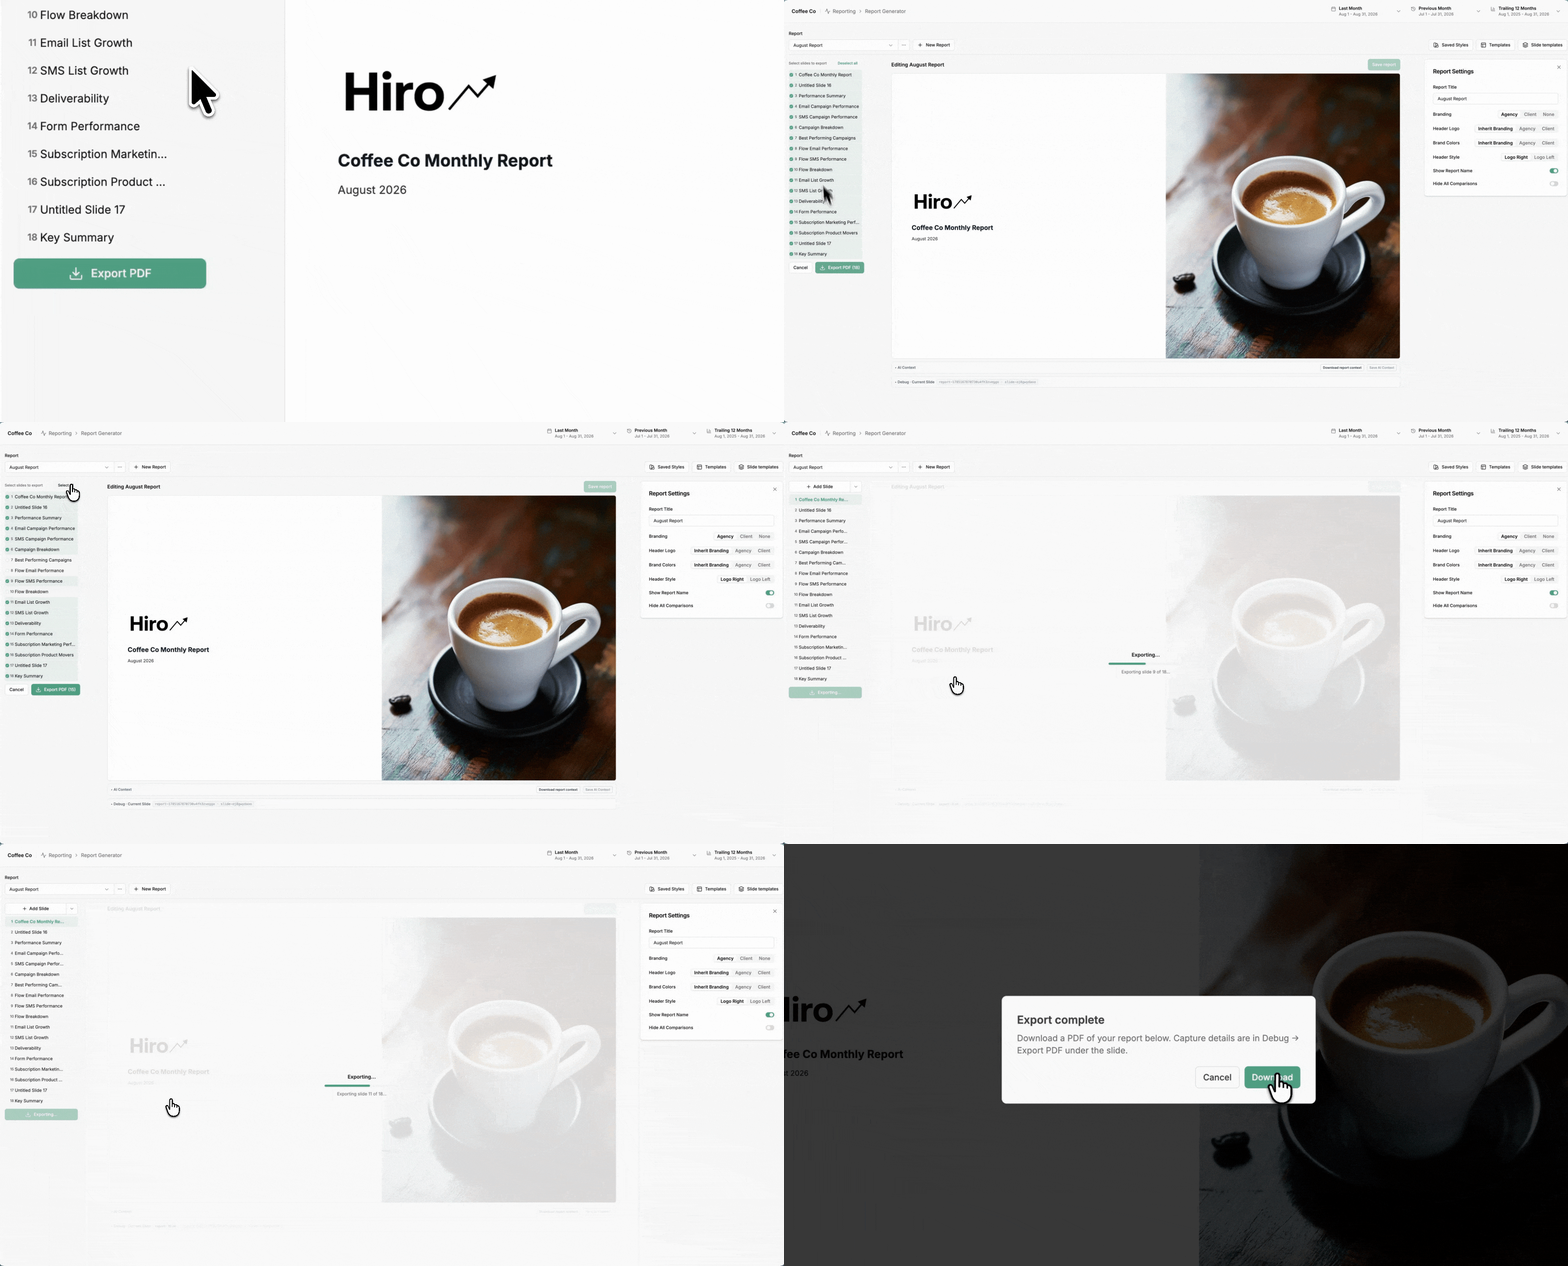
Select Export PDF in the slide list.
Select the slides you want to include in the PDF (or Select all) and click Export PDF. Hiro captures each slide and builds the PDF to download locally to your drive.
Select the Download button once export is complete.
Schedule a recurring export
From the report options (⋯) menu, select Schedules, then Add schedule. The schedule editor lets you configure:
Field | What it controls |
|---|---|
Schedule | Daily, Weekly, or Monthly |
Day (weekly) | Which day(s) of the week to send |
Day (monthly) | Which day(s) of the month to send |
Time of day | When the export runs |
Recipients | Email addresses to send the PDF to — enter one at a time |
Slides to Export | Which slides are included in the scheduled PDF |
Regenerate AI Notes — Slide | Per-slide toggle. Refreshes that slide's own notes from the latest data when the export runs. |
Regenerate AI Notes — Report | Per-slide toggle. Refreshes the report-level summary from the latest data when the export runs. |
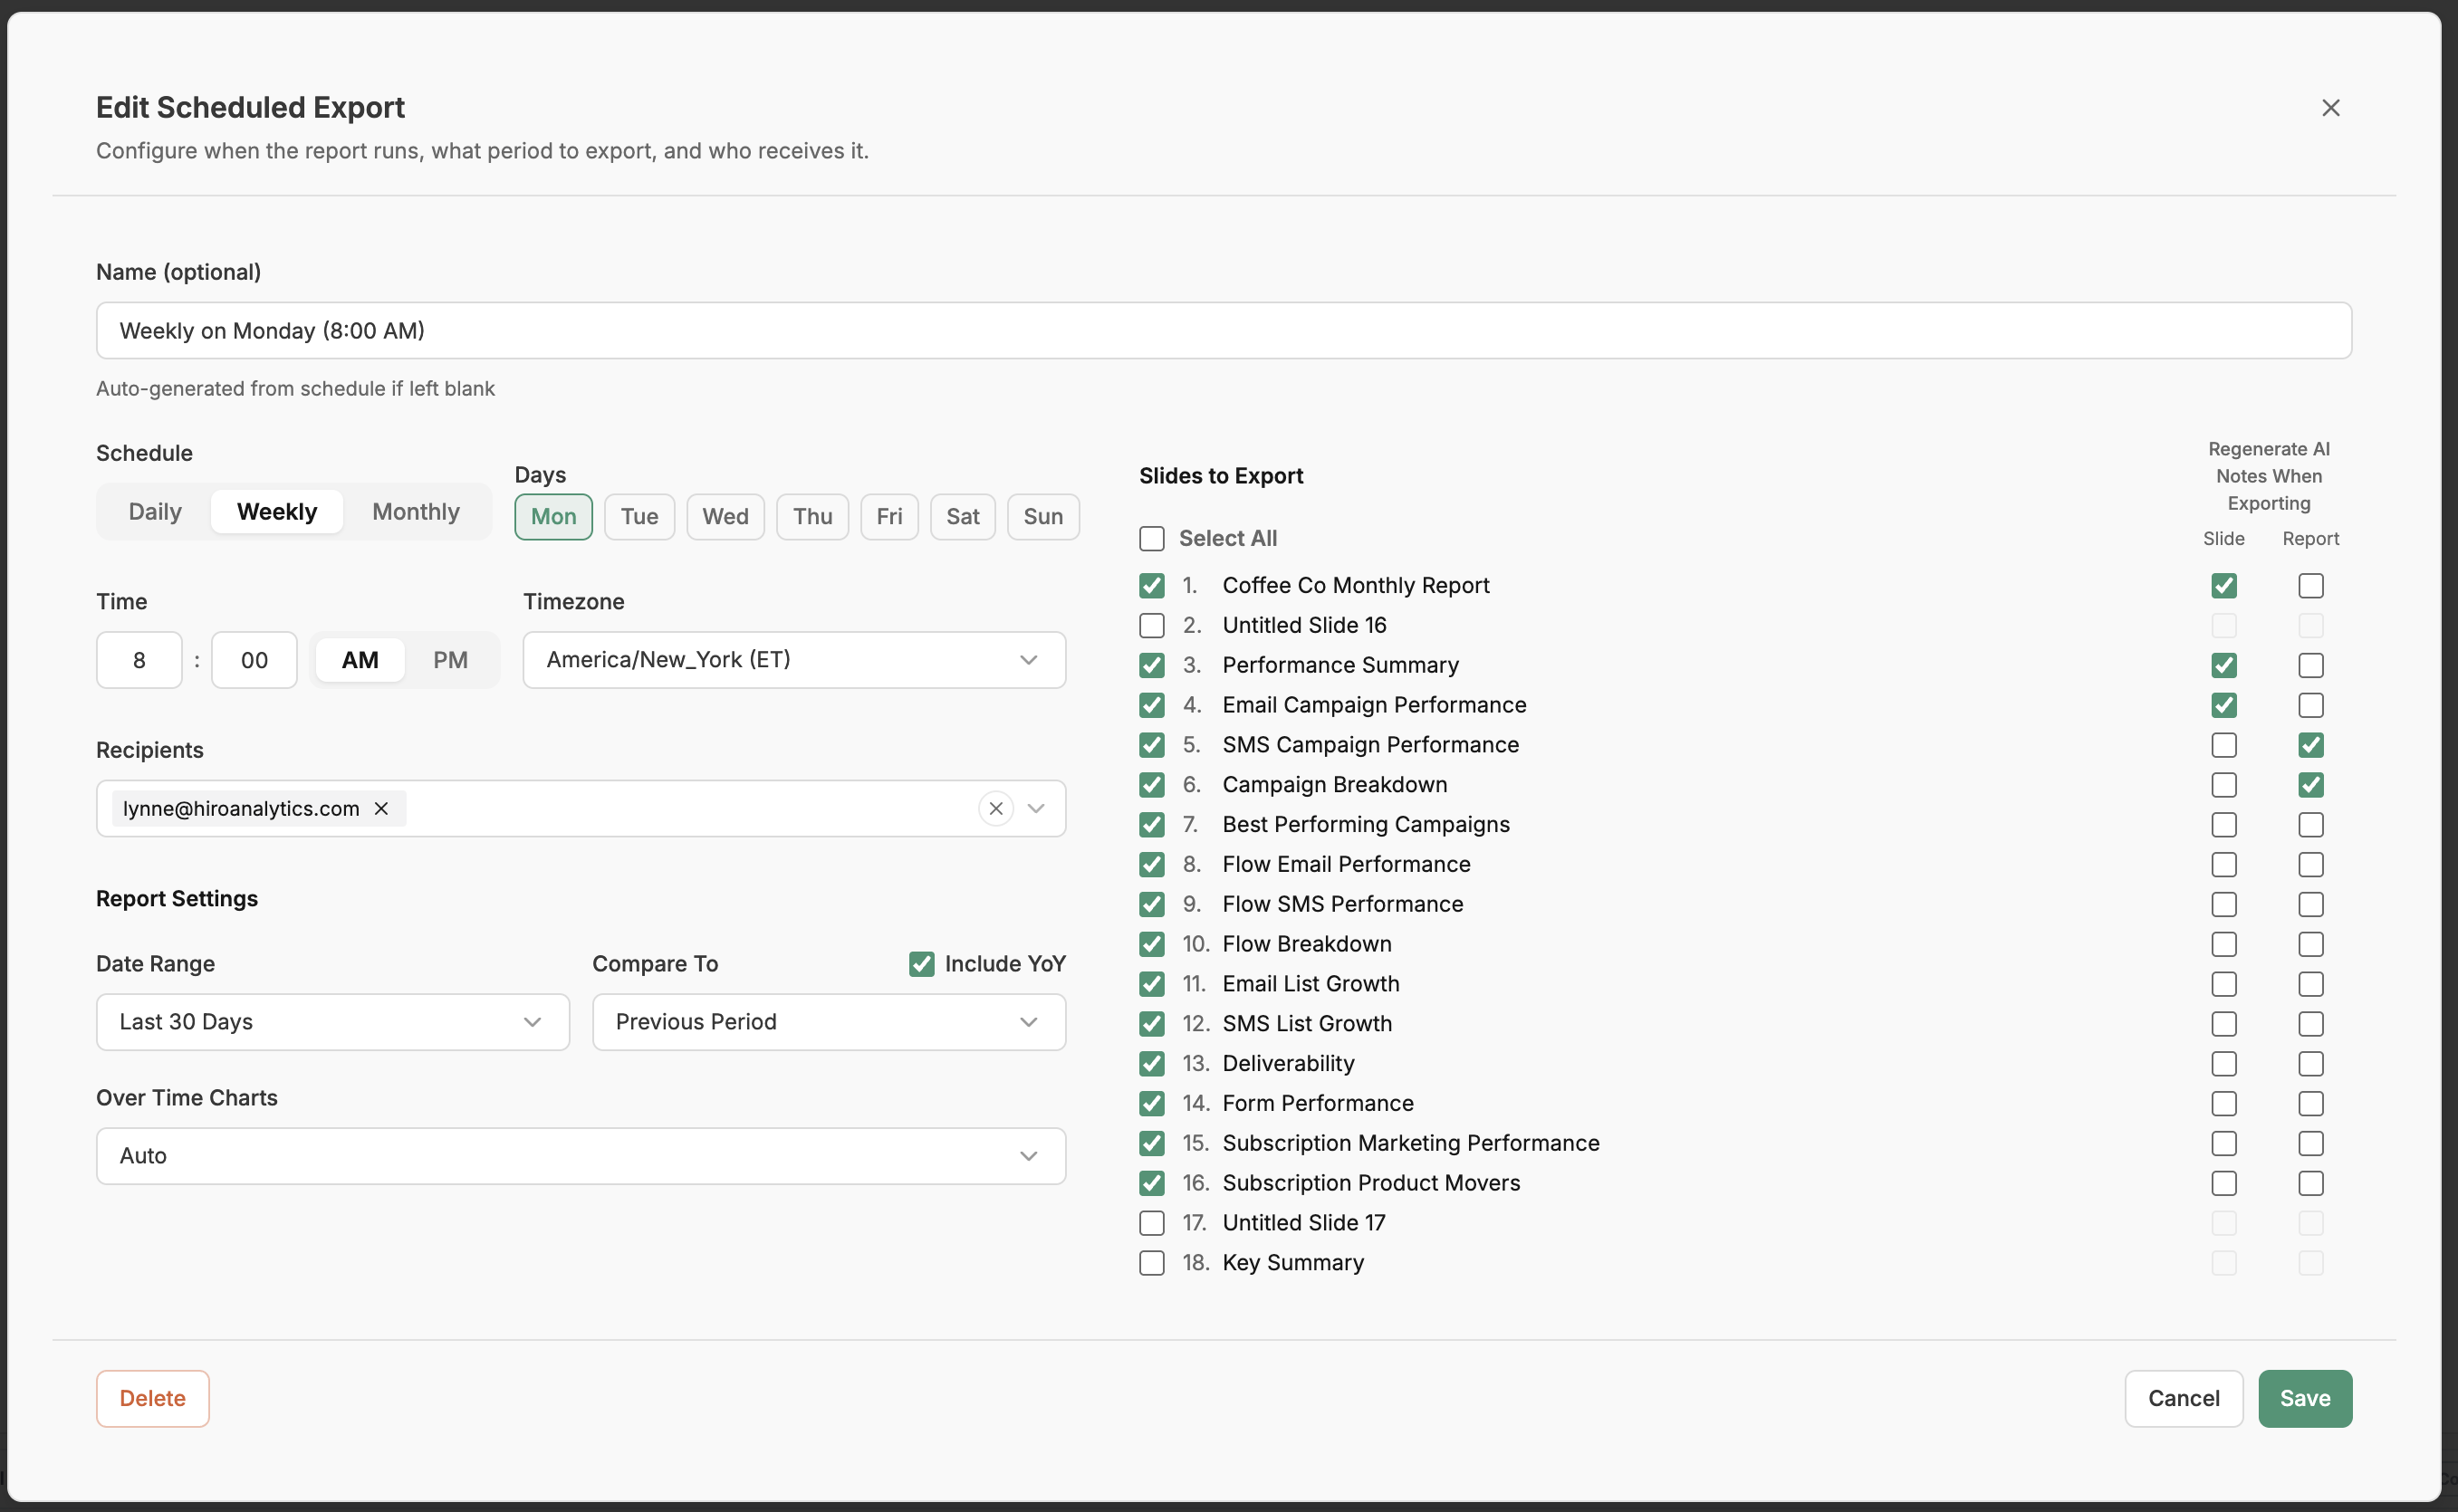
Save the schedule and Hiro will generate and email the PDF automatically on that cadence.
You can edit or delete a scheduled export from the Schedules dialog at any time from the same report options.
Need Help?
If you need assistance building/scheduling a report, or want to report any bugs, reach out via your dedicated Slack support channel or help@hiroanalytics.com and our team will help you get set up.